Model Serving
The Model Serving Phase is where a validated machine learning model is prepared for production use. It ensures seamless deployment, reproducibility, and scalability while maintaining accountability.
Key aspects to take into account while AI Model releasing:
-
Versioning and Registry: The model is versioned in a registry with metadata like training data, performance metrics, and hyperparameters. This step was already done by the Kubeflow Pipeline by publishing the model into the OpenShift AI Model Registry.
-
Packaging: The model and its dependencies are prepared for consistent execution by containerizing them or converting them into standardized formats like ONNX or TorchScript. During the workshop, we demonstrated how to "export" the model from its native PyTorch format into other formats. For instance, TorchScript is particularly well-suited for edge deployments due to its compact size and efficiency. However, for simplicity in this workshop, you will continue using the native PyTorch file format. This approach ensures flexibility while allowing you to explore the practical benefits of exporting models in production scenarios.
-
Validation: Additional tests, such as performance, integration, and scalability, are conducted in staging environments to ensure the model meets production requirements. In this workshop, we will perform a simple live test of the model to verify its functionality before proceeding with full deployment to edge devices.
-
Deployment: Techniques like blue-green or canary deployments are commonly used to ensure a smooth and reliable transition to production. While OpenShift AI offers Model Serving capabilities through
KServeandModelMeshfor models within the same cluster, deploying inference on a different environment—such as a Single Node OpenShift cluster or directly on Red Hat Enterprise Linux—requires a separate workflow to handle model transfer and deployment. -
Monitoring: Metrics such as latency, resource usage, and data drift are continuously tracked to ensure the model’s performance remains optimal. However, when deploying models at the Edge, the monitoring tools provided by OpenShift AI (e.g., TrustyAI, Grafana) cannot be used directly. Alternative monitoring strategies suited for Edge environments will be explored in detail in the next section.
OpenShift AI provides robust serving platforms to deploy models as inference endpoints:
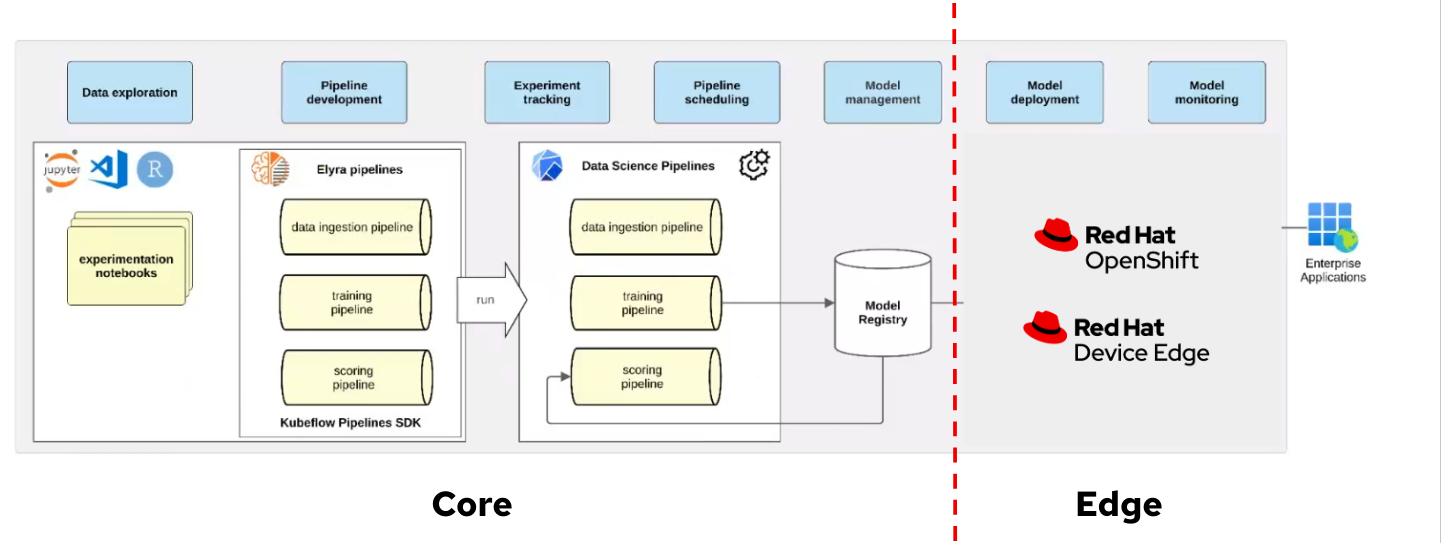
We can use those to deploy our models in the same OpenShift cluster where the OpenShift AI platform is running but, as mentioned, these options could not be directly available for your edge use case, remember that for our use case the MLOps workflow diagram is:
If you are using Microshfit or OpenShift at the Edge you can use the Kserve Custom Resource Definitions but if you plan to deploy your model directly on RHEL, without a Kubernetes API, you will need to use a different approach, for example running containers directly with Podman using Quadlets to configure them.
In any case you also have to take some decisions. We’ve already explored several options for deploying a model, for example, you can use the model file directly with an inference server running on your system, run the inference server inside a container, use a container image that bundles both the model and the inference server, or run separate containers for the model and the inference server (this is what we are doing in this workshop). But there are other decisions to be taken besides how to distribute the model, for example if you want to do the model serving with an off-the-self (or vendor-backed) inference server or use one custom server created add-hoc, each has it’s own pros and cons.
Vendor-backed inference servers offer several advantages. They are typically feature-rich, providing built-in capabilities such as model management, versioning, and performance optimization. They also come with out-of-the-box support for popular machine learning frameworks, which simplifies integration. Additionally, they significantly reduce development effort, allowing teams to focus more on deploying and scaling rather than building infrastructure from scratch.
However, these solutions also have downsides. They tend to consume more system resources due to their general-purpose nature and extensive feature sets. Customization options can be limited, as these tools are often designed to fit broad use cases. There’s also a level of dependency on the vendor, which can impact flexibility and long-term support strategies.
On the other hand, custom inference servers are optimized for specific use cases, making them lightweight and highly flexible. They allow you to tailor performance and resource usage precisely to your needs. But this comes at the cost of increased development and maintenance effort. They typically offer fewer features and require self-support, which may not be ideal for teams without strong in-house expertise.
In this workshop we will be using an off-the-self inference server, Triton Server, more specifically the one provided by NVIDIA. Triton uses the KServe community standard inference protocols to define HTTP/REST and GRPC APIs plus several extensions so it is a good fit.
| Triton Inferece Server is a tested and verified runtime. These runtimes are not directly supported by Red Hat. You are responsible for ensuring that you are licensed to use any tested and verified runtimes that you add, and for correctly configuring and maintaining them. For more information read Tested and verified model-serving runtimes KB article |
As an AI specialist, you won’t be deploying directly to edge devices, but you can still deploy your model—along with an inference server—on your OpenShift cluster to conduct meaningful testing. In fact, you can go a step further and deploy the entire service architecture to perform end-to-end testing, allowing you to observe how your model behaves within a realistic, production-like environment.
In this section, we will explore how to deploy our model and examine the inference performance. After that you will also deploy the associated microservices to do an end-to-end validation of the architecture used for the workshop use case. This architecture leverages the model’s predictions to create a system that raises alarms when individuals are not wearing hardhats. Lastly you will promote your model to be used in production.

Tools and preparations
We’ll use the following tools:
-
OpenShift AI: To deploy and monitor the Inference Server
-
Quay Container Image Registry: Where we have our
modelcarcontainer image -
OpenShift: To deploy the use case microservices that work along with the inference server to provide an end-to-end solution.
Inference testing

Let’s dive into deploying the Inference Server with our model!
Inferencing with OpenShift AI
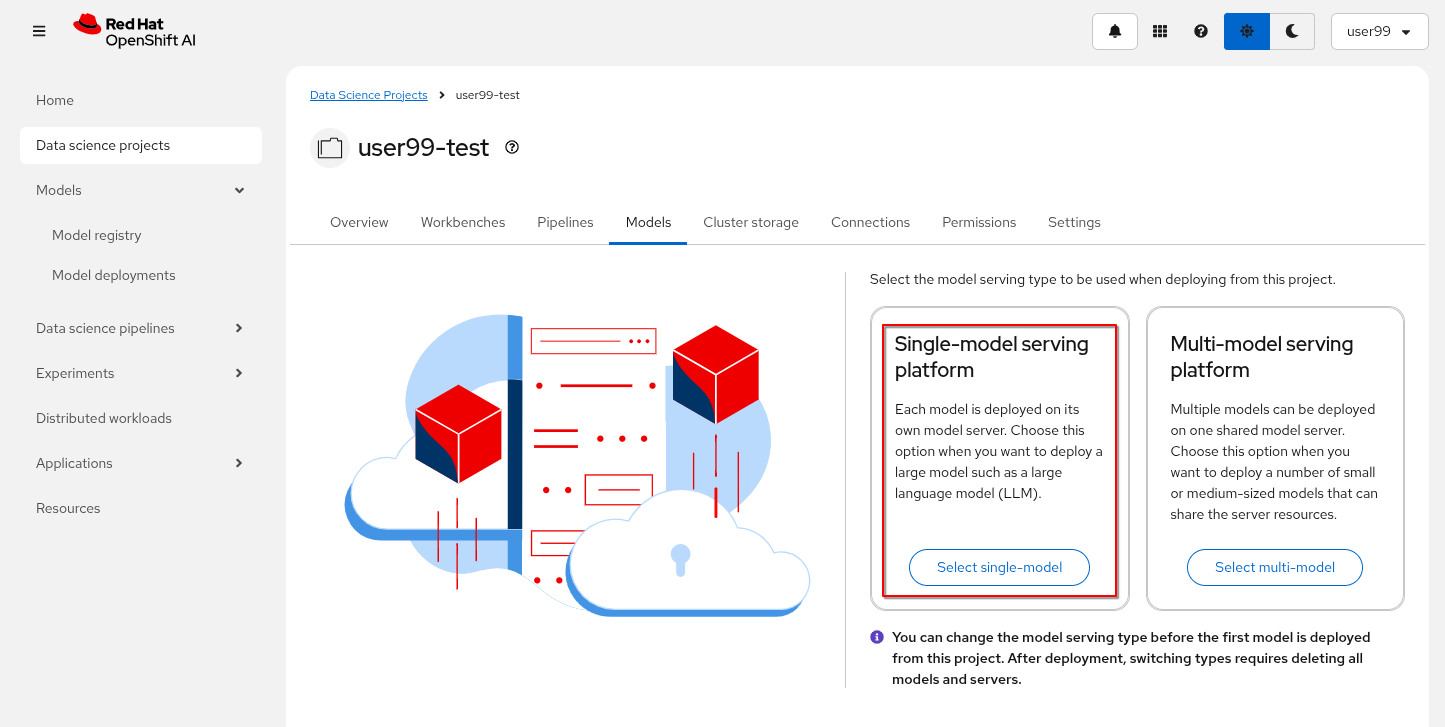
Before deploying an inference server in your OpenShift AI project, you need to decide which type of inference server to use. There are two options available:
-
Single-model serving: Each model is deployed on its own dedicated model server.
-
Multi-model serving: Multiple models share a single model server instance.
For this workshop, we’ll use single-model serving. Let’s walk through how to enable it in our test project:
1- Go to OpenShift AI
2- Move to "Data Science Projects"
3- Go to the USERNAME-test
4- Click the "Models" tab
5- Select "single-model" platform
Once you’ve enabled an inference platform, you can proceed to deploy the inference server. As mentioned earlier, we’ll be using the NVIDIA Triton Inference Server, which has already been made available in the environment by (that has previously make available in the environment by creating this template in OpenShift).
The model we’ll use is in ONNX format and is embedded in the modelcar container image generated by our pipeline. Therefore, we need to reference that OCI image, which is hosted in our internal Quay container registry, as indicated in the corresponding Model Registry entry created by the pipeline.
1- Go to OpenShift AI
2- Move to "Models > Model Registry" and select your model
3- Click on the version that you want to test
4- Select "Deploy" on the top right corner
5- Select the project USERNAME-test and fill-in the form:
-
Model name:
hardhat-test(we use that name in a Job below) -
Serving runtime:
NVIDIA Triton Server v25.03 (gRPC) -
Framework:
onnx - 1.20.1 -
Deployment mode:
Standard -
Number of replicas:
1 -
Model server size:
Small -
Accelerator: If you have GPUs available choose your accelerator.
-
Make deployed models available through an external route:
not selected -
Require token authentication:
not selected -
Create a new connection:
-
Connection type:
OCI compliant registry -v1 -
Conection name: I suggest something like
quay-hosted -
Access type: Push + Pull
-
Secret details:
CONTAINER_REGISTRY_DOCKERCONFIGJSON -
Registry host:
workshop-registry-quay-openshift-operators.apps.CLUSTER_DOMAIN -
OCI storage location: Keep the auto-completed URL
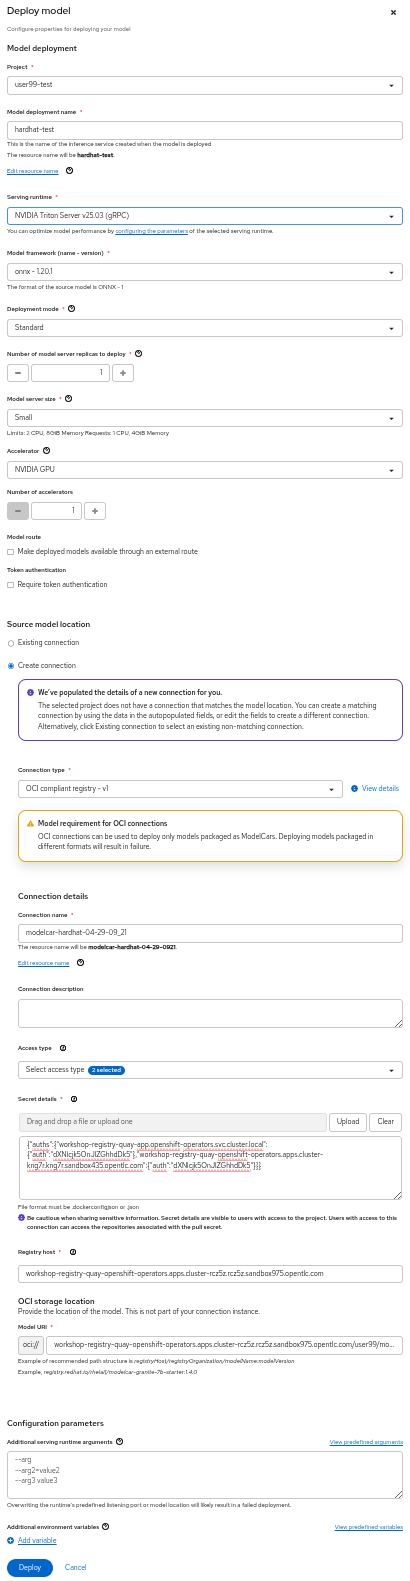
| Advanced deployment mode uses Knative Serverless. By default, KServe integrates with Red Hat OpenShift Serverless and Red Hat OpenShift Service Mesh to deploy models on the single-model serving platform. Red Hat Serverless is based on the open source Knative project and requires the Red Hat OpenShift Serverless Operator. Alternatively, you can use standard deployment mode, which uses KServe RawDeployment mode and does not require the Red Hat OpenShift Serverless Operator, Red Hat OpenShift Service Mesh, or Authorino. In this workshop we will use the RAWdeployment at the edge so we will also reproduce that deployment type in our tests. For more information you can read the OpenShift AI documentation. |
6- Click "Deploy"
| The Inference Server may take some time to become available upon initial deployment but you should see it deploying. If you don’t see any deployed model go to "Models > Model deployments" and be sure that you are in the right Project (USERNAME-test). |
If you want to see the deployment progress or check the Inference Server logs you can go to the OpenShift Console and check "Workloads > Pods". If you click on the Pod’s name you will have access to the "Events" and "Logs".
The Pod consists of four containers and one init container. You can view the logs for each by selecting them from the dropdown menu, which defaults to kserve-container. In the modelcar-init container, you can observe how the model file is copied from the container image—created by the OpenShift Pipeline—to the Inference Server. To monitor the Inference Server itself, check the logs in the kserve-container. Once the server is fully initialized, you should see a log entry similar to the following:
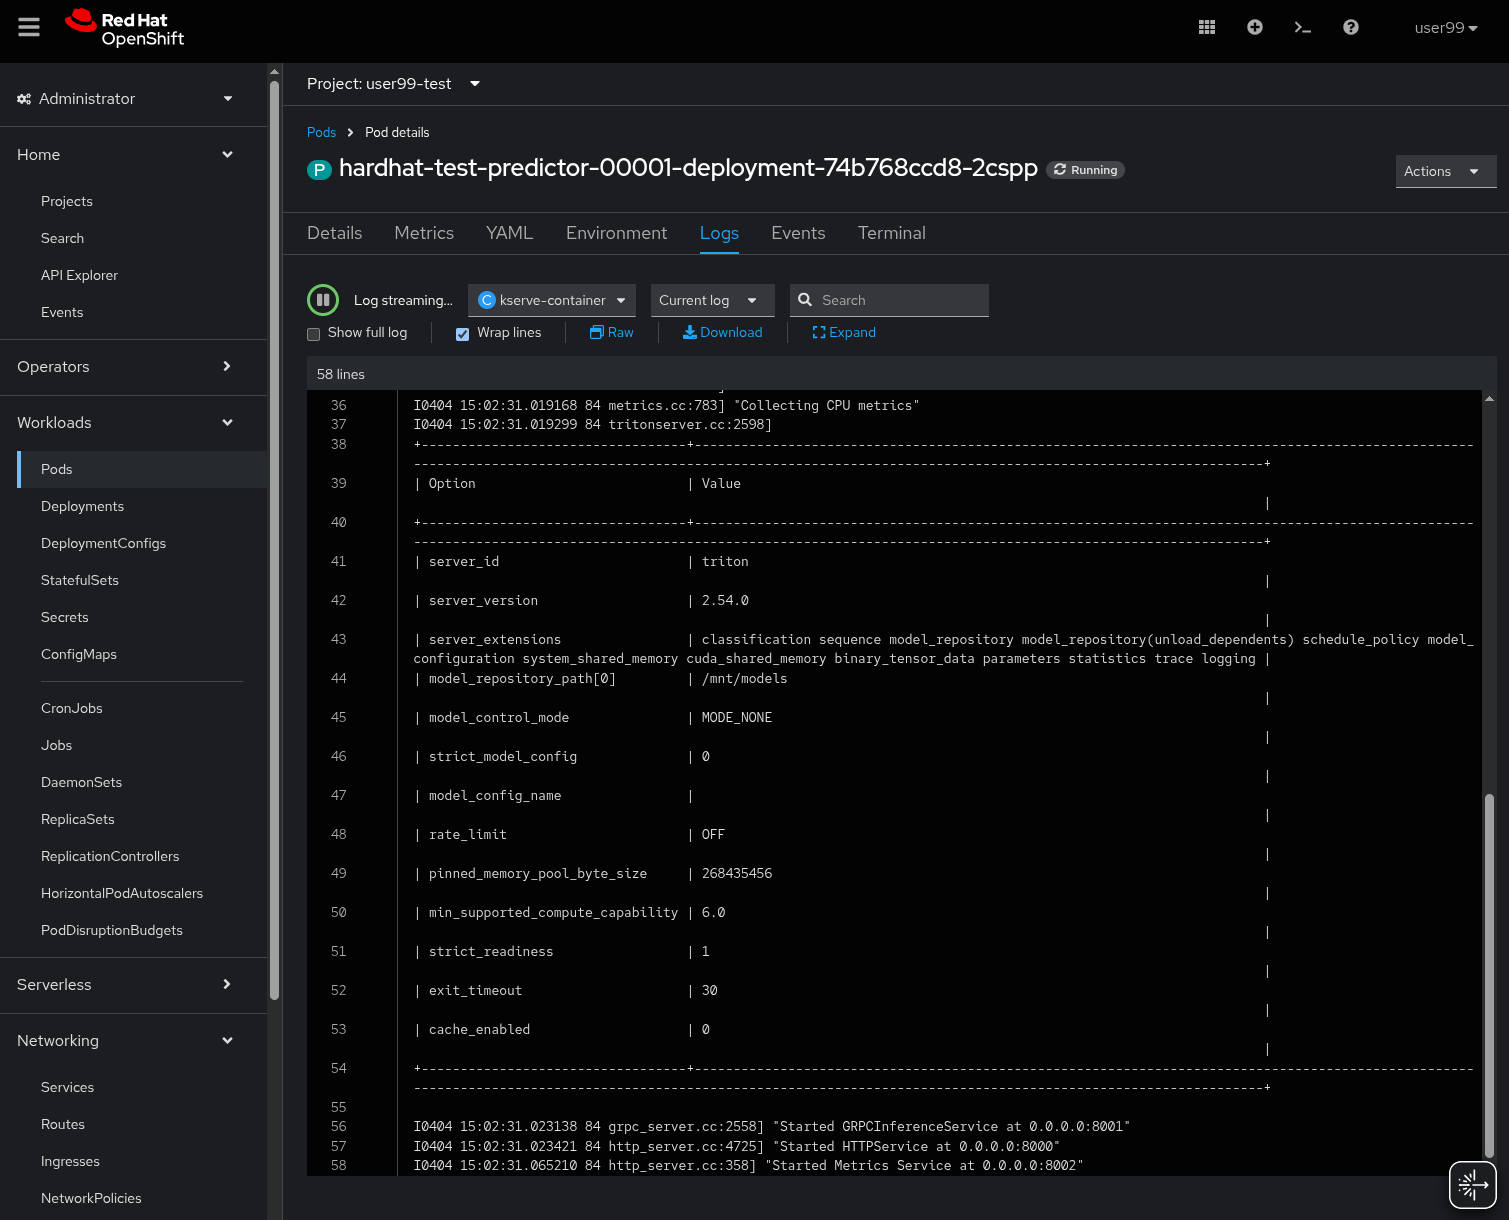
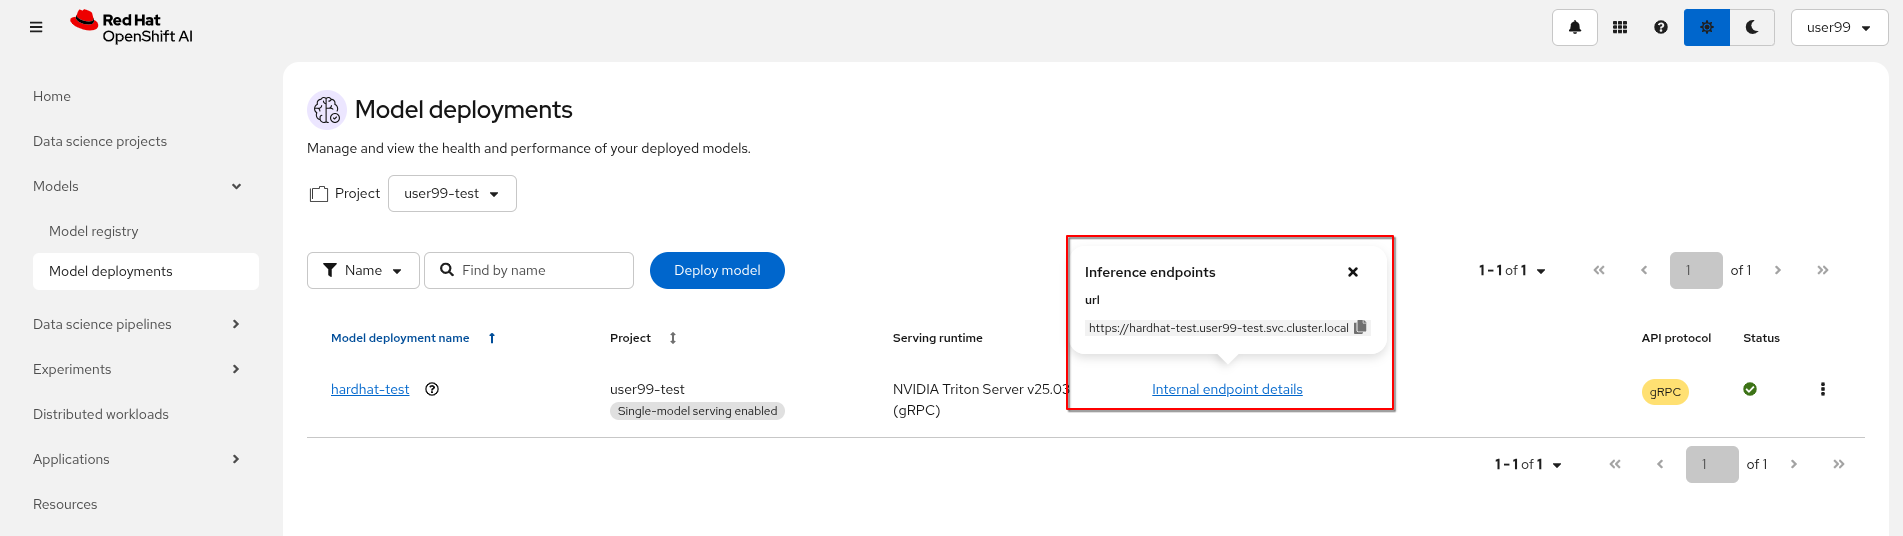
When the Inference server appears as avialable in the OpenShift AI console, you will be able to copy the internal endpoint that we need to use to access to it. For more information about Triton available endpoints you can read the NVIDIA Triton Inference Server endpoints documentation.
Now that the Inference Server is running and you have the endpoint needed to access it, let’s deploy a test application that uses the server to tag a set of images.
1- Go to the "Administrator" view in the OpenShift Console
2- Click on the + button on the top right corner of the UI to deploy a new YAML file
3- Be sure that you are in the right project (USERNAME-test) and paste the following YAML
apiVersion: apps/v1
kind: Deployment
metadata:
  name: object-detection-batch-kserve-api
  labels:
    app: object-detection-batch-kserve-api
spec:
  replicas: 1
  selector:
    matchLabels:
      app: object-detection-batch-kserve-api
  template:
    metadata:
      labels:
        app: object-detection-batch-kserve-api
    spec:
      containers:
      - name: batch-model-api
        image: quay.io/luisarizmendi/object-detection-batch-kserve-api:grpc
        ports:
        - containerPort: 8800
        env:
          - name: TRITON_SERVER_URL
            value: '<CHANGE ME TO INFERENCE INTERNAL ENDPOINT>:8001'
          - name: MODEL_NAME
            value: 'hardhat'
---
apiVersion: v1
kind: Service
metadata:
  name: object-detection-batch-kserve-api
  labels:
    app: object-detection-batch-kserve-api
spec:
  selector:
    app: object-detection-batch-kserve-api
  ports:
  - protocol: TCP
    port: 8800
    targetPort: 8800
  type: ClusterIP
---
apiVersion: route.openshift.io/v1
kind: Route
metadata:
  name: object-detection-batch-kserve-api
  labels:
    app: object-detection-batch-kserve-api
spec:
  to:
    kind: Service
    name: object-detection-batch-kserve-api
  port:
    targetPort: 8800
  tls:
    insecureEdgeTerminationPolicy: Redirect
    termination: edge
4- Change the <CHANGE ME TO INFERENCE INTERNAL ENDPOINT> string with the internal endpoint value that you copied from the deployed Inference Server. If you used the values proposed in the workshop the MODEL_NAME environment variable will be hardhat so you can keep the default
5- Click "Create"
6- Wait until the POD is in "Running" status and then move to "Networking > Routes"
7- Open the application’s URL
You’ll see a UI with the endpoint of your Inference Server pre-selected. You can now upload images of people wearing or not wearing hard hats to the application (for example, images from the "Test" set of your dataset), then click "Submit".
Make sure the uploaded images do not show 0 KB in size. Chrome does not support drag-and-drop in all contexts, and depending on where the files are stored on your computer, they may fail to upload.
|
The inference process may take some time depending on the number of images and whether you’re using a GPU. Once it completes, you should see a result similar to the following:
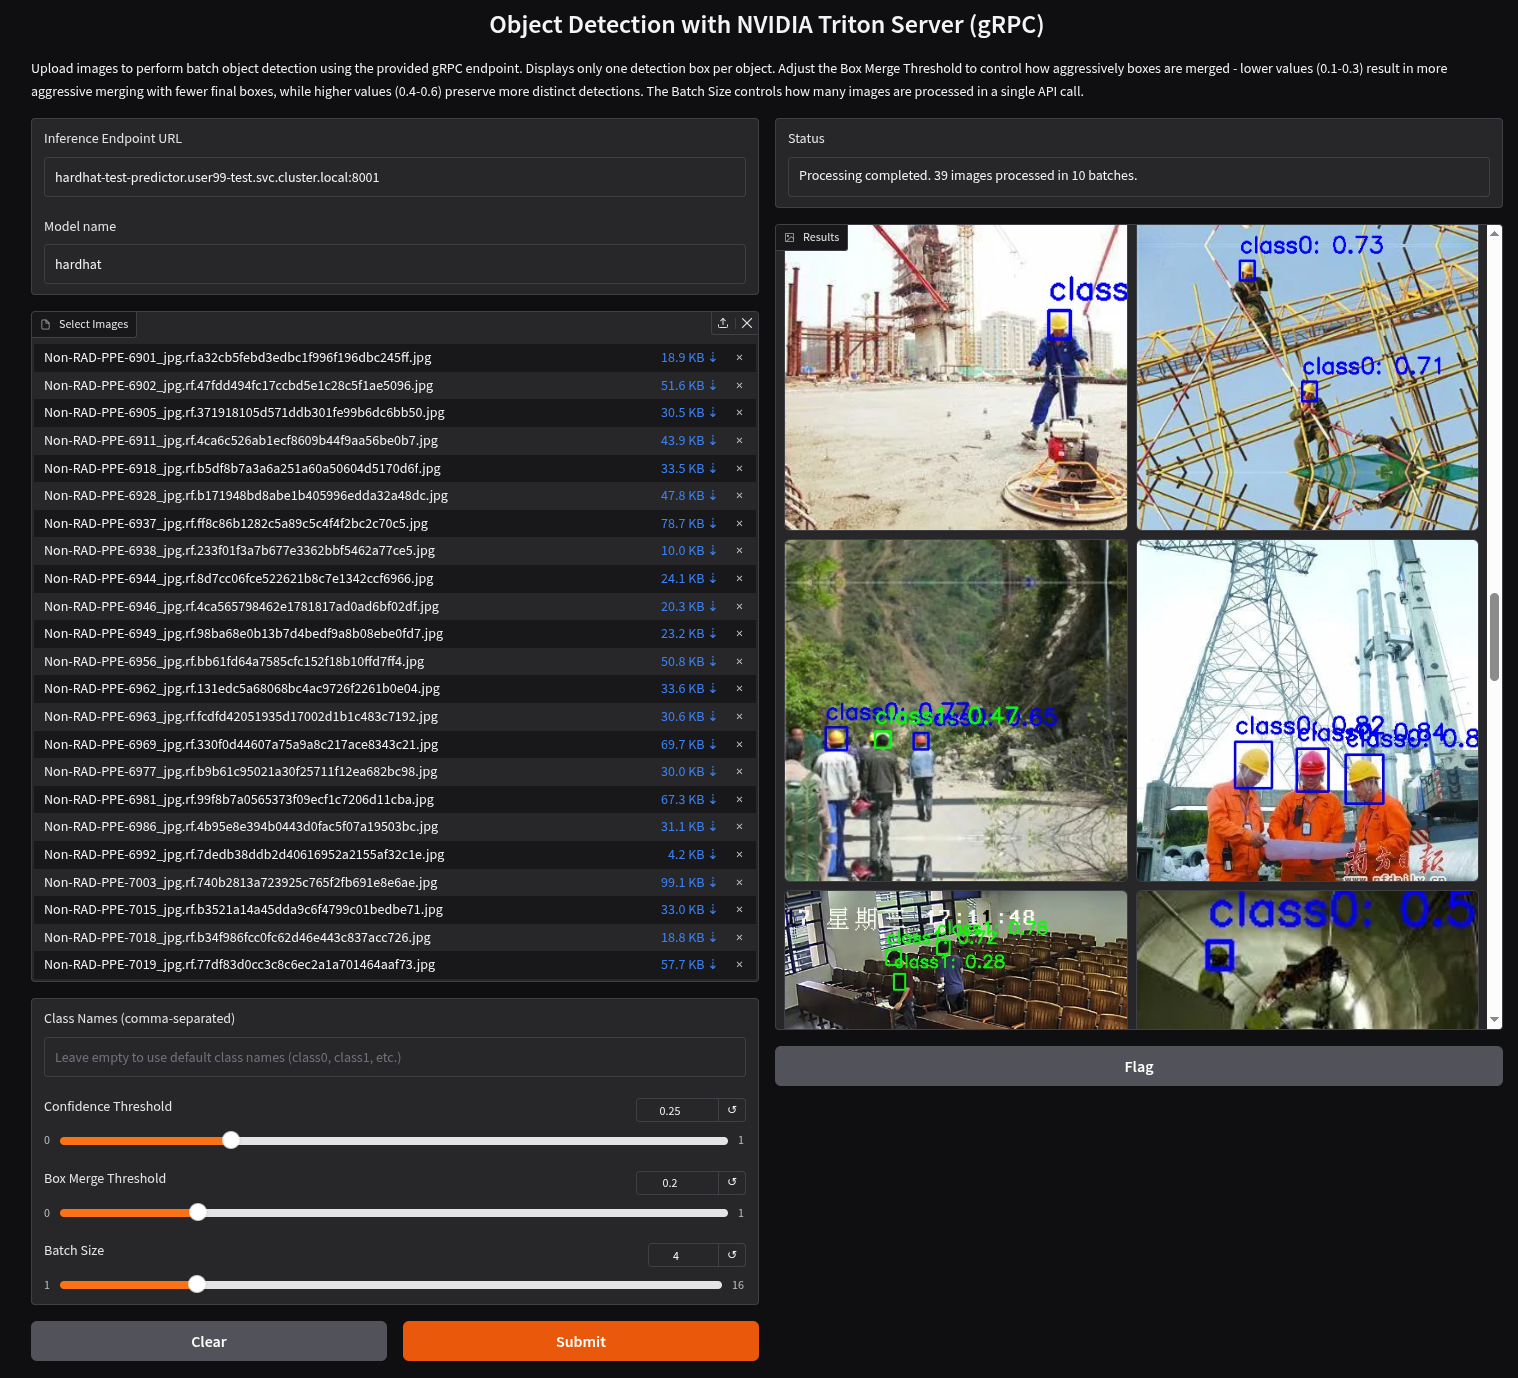
As you can see, hardhats were detected on the images, so we are good to perform an end-to-end validations of the model using the microservices used in production.
| If you are interested on it, you can find the test application source code here |
End-to-End Validation

So far, you have completed the AI Specialist’s tasks by creating the model and taken on some Application Development responsibilities by manually building the container images. Now, before handing over to the Platform Specialist for deploying the applications to the Edge devices, it’s a good idea to perform a final test of the model you created. Let’s deploy all the components together and verify if everything works as expected.
Overview of the solution
Before diving into the deployment details, let’s first understand the overall solution architecture, including the microservices involved and how they communicate. In this architecture we use a webcam to detect objects at the edge, and how those detections can trigger messages/alarms that can be visualized in a dashboard on the Core Datacenter/Cloud.
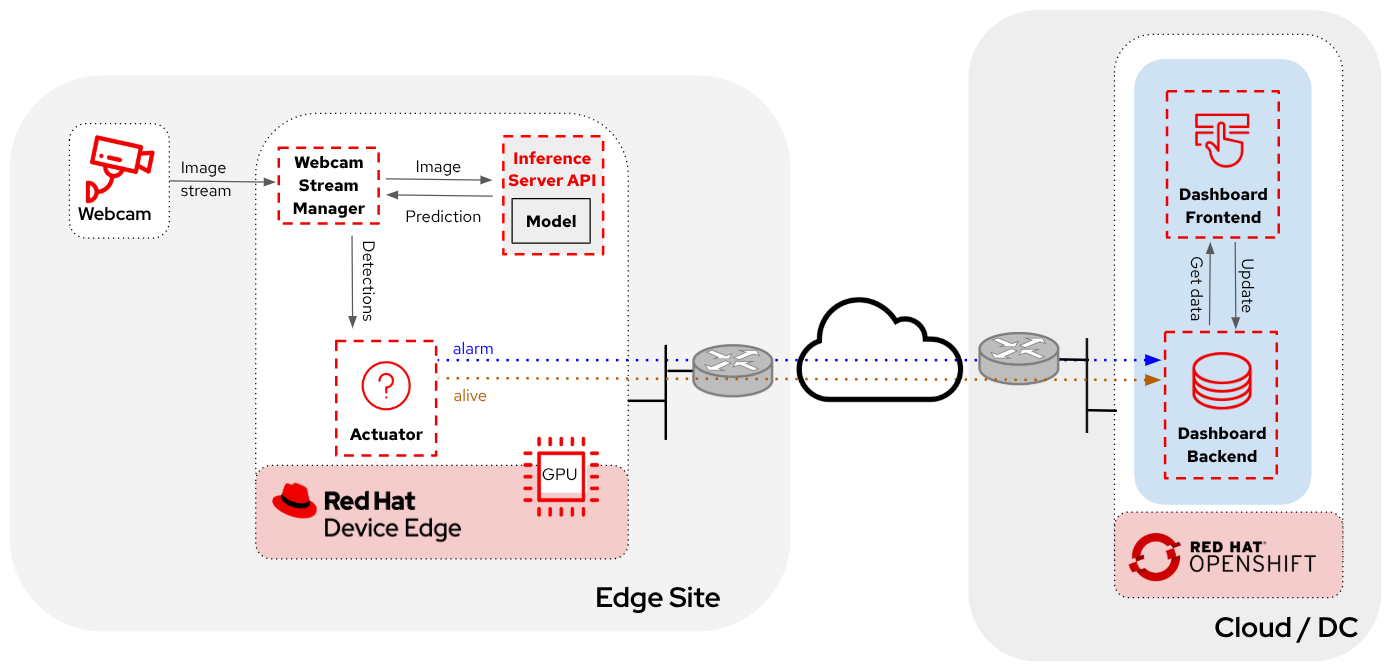
The solution is based on the following microservices, you can clik on the names to get detailed information about each one:
-
Inference server
The workflow is the following:
-
The Camera Stream Manager sends images to the Inference API
-
The Inference Server, that contains the AI model detecting objects, returns the predictions
-
The "Action" service calls the inference endpoint and if detects certain objects it will trigger an alarm, that is sent to the database hosted in a remote site.
-
The information of the device is shown in the Dashboard
As you can see, there are both edge (local-side) and cloud or data center (cloud-side) environments. Let’s now explore how to deploy services in each of them.
Cloud-side Applications deployment
| Instructions below are using the provided pre-created container images, but you can use your own images. Check the module Bonus: Building the APPs |
Follow the steps below to create the Dashboard backend and Dashboard frontend applications in OpenShift:
1- Navegate to the "Administrator" view in the OpenShift Console
2- Log in using your OpenShift credentials: USERNAME / PASSWORD.
3- Be sure that you are in the (USERNAME-test) project
4- Click on the + icon on the top right corner of the OpenShift console to deploy a new YAML file.
5- Double-check that you are in the USERNAME-test project and paste there the content shown below to deploy the Dashboard, then click "Create".
apiVersion: batch/v1
kind: Job
metadata:
  generateName: dashboard-deploy-
spec:
  selector: {}
  template:
    metadata:
      name: dashboard-deploy
    spec:
      containers:
        - name: shell
          image: quay.io/luisarizmendi/ocp-job:latest
          command: ["/bin/sh", "-c"]
          args:
          - |
            NAMESPACE=$(< /var/run/secrets/kubernetes.io/serviceaccount/namespace)
            echo "Using namespace $NAMESPACE"

            echo "Creating Dashboard Backend"

            oc apply -f - <<EOF
            apiVersion: apps/v1
            kind: Deployment
            metadata:
              name: object-detection-dashboard-backend
              labels:
                app: object-detection-dashboard
                app.kubernetes.io/part-of: Dashboard
                app.openshift.io/runtime: "python"
            spec:
              replicas: 1
              selector:
                matchLabels:
                  app: object-detection-dashboard
                  component: backend
              template:
                metadata:
                  labels:
                    app: object-detection-dashboard
                    component: backend
                spec:
                  containers:
                  - name: backend
                    image: quay.io/luisarizmendi/object-detection-dashboard-backend:v1
                    ports:
                    - containerPort: 5005
            ---
            apiVersion: v1
            kind: Service
            metadata:
              name: object-detection-dashboard-backend
              labels:
                app: object-detection-dashboard
            spec:
              selector:
                app: object-detection-dashboard
                component: backend
              ports:
              - protocol: TCP
                port: 5005
                targetPort: 5005
              type: ClusterIP
            ---
            apiVersion: route.openshift.io/v1
            kind: Route
            metadata:
              name: object-detection-dashboard-backend
              labels:
                app: object-detection-dashboard
            spec:
              to:
                kind: Service
                name: object-detection-dashboard-backend
              port:
                targetPort: 5005
            EOF

            while true; do
              HOST=$(oc get route object-detection-dashboard-backend -n $NAMESPACE -o jsonpath='{.status.ingress[0].host}')
              if [[ -n "$HOST" ]]; then
                BACKEND_API_BASE_URL="http://$HOST"
                break
              fi
              sleep 2
            done
            echo "BACKEND API URL: $BACKEND_API_BASE_URL"

            echo "Creating Dashboard Frontend"

            oc apply -f - <<EOF
            apiVersion: apps/v1
            kind: Deployment
            metadata:
              name: object-detection-dashboard-frontend
              labels:
                app: object-detection-dashboard
                app.kubernetes.io/part-of: Dashboard
                app.openshift.io/runtime: "nodejs"
              annotations:
                app.openshift.io/connects-to: '[{"apiVersion":"apps/v1","kind":"Deployment","name":"object-detection-dashboard-backend"}]'
            spec:
              replicas: 1
              selector:
                matchLabels:
                  app: object-detection-dashboard
                  component: frontend
              template:
                metadata:
                  labels:
                    app: object-detection-dashboard
                    component: frontend
                spec:
                  containers:
                  - name: frontend
                    image: quay.io/luisarizmendi/object-detection-dashboard-frontend:v1
                    ports:
                    - containerPort: 3000
                    env:
                    - name: BACKEND_API_BASE_URL
                      value: $BACKEND_API_BASE_URL
            ---
            apiVersion: v1
            kind: Service
            metadata:
              name: object-detection-dashboard-frontend
              labels:
                app: object-detection-dashboard
            spec:
              selector:
                app: object-detection-dashboard
                component: frontend
              ports:
              - protocol: TCP
                port: 3000
                targetPort: 3000
              type: ClusterIP
            ---
            apiVersion: route.openshift.io/v1
            kind: Route
            metadata:
              name: object-detection-dashboard-frontend
              labels:
                app: object-detection-dashboard
            spec:
              to:
                kind: Service
                name: object-detection-dashboard-frontend
              port:
                targetPort: 3000
            EOF

      restartPolicy: Never
6- When all pods are running, you can http://object-detection-dashboard-frontend-USERNAME-test.apps.CLUSTER_DOMAIN [open the Dashboard using the Frontend URL]. You will see an empty page with the "Device Monitoring Dashboard" title.
The Dashboard application does not use TLS, so the URL must start http:// and https:// otherwhile you will get a message "Application is not available" even when then POD is already running.
|
Local machine applications deployment
You’ve successfully deployed the cloud-side applications! Now, take the next step by running the remaining applications on your own laptop
| Instructions below are for Fedora/RHEL based systems and using the interactive mode, so you can review live logs easily (you will need to use three different command line terminals). |
Be sure that you have the ports tcp/8080, tcp/8000, tcp/8001 and tcp/5000 ports open un your local machine.
|
Inferencing with a CPU can be slow. However, if you have an NVIDIA GPU in your laptop, you can deploy the Inference Server using it for testing. But what if you don’t have one? You have two options at this point.
Stick to the Edge Computing setup (inferencing at the edge/laptop), accepting slower frame detection. While not ideal, my tests have shown it remains functional, or leverage an OpenShift Cluster with GPUs (if available through this workshop). This allows you to deploy the Inference Server in the Cloud instead of your local machine for testing.
While the second option provides faster inferencing, it is not a true Edge Computing architecture. Sending images from the edge to the Cloud introduces network delays and additional costs, two key drawbacks that edge computing is designed to mitigate. However, for a quick test, it offers a practical way to achieve high-speed inferencing.
| This deployment is also useful for comparing Edge vs. Non-Edge setups. You can test with or without a GPU in both environments to evaluate user experience, delays, and performance trade-offs. |
So in summary, no you can either reuse the inference server you already deployed on OpenShift, or you can try a more realistic architecture by deploying a new inference server locally on your laptop. The second option is recommended if your laptop has a GPU or if your OpenShift environment doesn’t provide GPU support, in that case, at least you avoid the latency of sending inference requests to the cloud.
Let’s review both options.
Production-like test architecture (Inference at the Edge)
In this case you have to deploy in your laptop:
-
Inference server
-
Camera stream manager
-
Actuator
Deploy the Inference Server
Let’s start by the Inference server.
If you want to use NVIDA GPUs in your system, be sure that you have it configured in your system and that you run sudo nvidia-ctk cdi generate --output=/etc/cdi/nvidia.yaml before running the inference container.
|
1- Get the Inference Server deployment script.
2- Download the script and give it execution permission.
3- Run the script.
<your-script-name> create <MODELCAR IMAGE NAME:TAG>
Do not include the https:// when you include modelcar container image, it should be something like workshop-registry-quay-openshift-operators.apps.CLUSTER_DOMAIN/USERNAME/modelcar-hardhat:<TAG>. If you want to use a pre-created modelcar image instead the one that you created in the previous module you can use quay.io/luisarizmendi/modelcar-hardhat:v1
|
These are large images, the pull could take time, be sure that the inference server pod is running using podman ps
|
The script creates a Podman POD with an init-container (it runs before the "main" container starts) that pull the modelcar container, extract the model files and share them with the Inference Server. That’s the same approach that when you are using the modelcar in OpenShift.
The Inference service will be available at localhost:8001 (gRPC) and http://localhost:8000 (REST). You can check that the model has been loaded with the right values:
curl http://localhost:8000/v2/models/hardhatDeploy the Camera stream manager
Now that you have the inference server you can proceed with the Camera stream manager deployment. This is the service that will take images from your Webcam and send them to the Inference Server. It will also publish the detections in an endpoint.
In this case you will need to run it as privileged to access the system devices (webcams) and also to use the host network (to simplify inter-container communication), so it can reach out to the inference server.
sudo podman run -it --rm -p 5000:5000 --privileged --net host -e TRITON_SERVER_URL=localhost:8001 -e MODEL_NAME=hardhat -e CLASS_NAMES=helmet,no_helmet quay.io/luisarizmendi/object-detection-stream-manager:grpc| Remember to run it with privileges so it can access the video devices. |
You can add --gpus all if you have a GPU in your laptop and you want to use it for pre and post image processing.
|
You will see logs directly in the console terminal. The Inference Server may already be displaying detection results, and if a no_helmet detection occurs, the "Actuator" will trigger an alarm. Additionally, the Camera Stream Manager logs important details at startup, such as the selected webcam ID, providing useful insights for debugging and verification
| We are deploying the service version that uses gRPC to send data to the inference service because it introduces less overhead. If you want to review and use the REST version to compare it with the gRPC you can check the script README file. |
This won’t work for MAC users since camera access from containers is different in that OS. If you are a MAC user you can still run this service by downloading and running directly the object-detection-stream-manager.py python script on your system with python object-detection-stream-manager.py. Remember to install the python dependencies with pip install and to grant permissions to access cameras if needed.
|
|
During the container launch, you specify the class names. It’s important to note that the order of these names matters. In the provided pre-trained model, there are two classes: With the |
Before going ahead check the logs to be sure that there are no errors.
Deploy the Actuator Service
The final step is to deploy the "Actuator". This service will send keepalives to the Dashboard and also an alarm is the Camera stream manager detects no_helmet label in the images.
The "Actuator" service needs also to use the host network.
Also you will need to include the Dashboard backend route. Please, don’t forget the /alert and /alive as part of the environment variable value.
podman run -it --rm --network=host -e MONITORED_CLASSES=no_helmet -e ALERT_ENDPOINT=http://object-detection-dashboard-backend-USERNAME-test.apps.CLUSTER_DOMAIN/alert -e ALIVE_ENDPOINT=http://object-detection-dashboard-backend-USERNAME-test.apps.CLUSTER_DOMAIN/alive quay.io/luisarizmendi/object-detection-action:prod
The "Actuator" service needs also to use the host network. Also you will need to include the Dashboard backend route. Please, don’t forget the /alert and /alive as part of the environment variable value.
|
The value of the MONITORED_CLASSES environment variable must match with one or more of the the CLASS_NAMES configured in the Camera stream manager container. Those detections will trigger the alarm.
|
Before going ahead check the logs to be sure that there are no errors.
The Convenient yet non-Edge test architecture (Inference at the Cloud)
In the previous option we explained how to deploy the architecture that you will have in production using your laptop, but what if you don’t have GPUs in your laptop and you have them in your OpenShift cluster?, then this other deployment modality where you use the Inference Server runnning in OpenShift could be useful for you.
Let’s examine the non-edge architecture we’ll set up for testing. As you can see, the difference comparing it with the "pure" edge deployment is where the Inference Server is located.
Let’s deploy this architecture:
1- You will use the Inference Server already deployed in OpenShift, you don’t need to deploy it locally, but in our case you need to have something into account. We are using Triton Inference server without TLS so the easier way to provide a (working) access to it is configuring a NodePort or LoadBalancer Kubernetes service. At the edge you probably will be using NodePort but since we are testing on the Cloud let’s use LoadBalancer to simplify things a little bit.
You need to create a new service (you can use the + in the top right corner of the OpenShift Console) using a YAML like this one:
apiVersion: v1
kind: Service
metadata:
  name: hardhat-test-predictor-grpc
spec:
  type: LoadBalancer
  selector:
    app: isvc.hardhat-test-predictor
  ports:
    - name: grpc
      protocol: TCP
      port: 8001
      targetPort: 8001
If you did use the suggested name Inference Service name (hardhat-test) the YAML will be different
|
Once created you will find the Service external URI, it will be something like a39f639f10cc940939c1a4d8a54ca4fa-309729606.us-east-2.elb.amazonaws.com (remove the ; that you might find at the beginning if you copy paste from the "Networking > Services > Details" page)
| Sometimes the name resolution takes some time. Try to resolve that URI from your laptop before moving on. |
2- Deploy the "Camera Stream Manager". You can use the steps shown in the previous point, but with an small difference. You need to deploy the Camera Stream Manager indicating the URL endpoint for the Inference Server (by default it uses localhost). You can do it by using the TRITON_SERVER_URL environment variable to setup the external inference endpoint (INFERENCE_SERVER_URI:8001, using the provided example it will be something like a39f639f10cc940939c1a4d8a54ca4fa-309729606.us-east-2.elb.amazonaws.com:8001 ).
sudo podman run -it --rm -p 5000:5000 --privileged --net host -e TRITON_SERVER_URL=<CHANGE ME TO INFERENCE EXTERNAL ENDPOINT>:8001 -e MODEL_NAME=hardhat -e CLASS_NAMES=helmet,no_helmet quay.io/luisarizmendi/object-detection-stream-manager:grpc
3- Deploy the Actuator in the same way than in the previous point:
podman run -it --rm --network=host -e MONITORED_CLASSES=no_helmet -e ALERT_ENDPOINT=http://object-detection-dashboard-backend-USERNAME-test.apps.CLUSTER_DOMAIN/alert -e ALIVE_ENDPOINT=http://object-detection-dashboard-backend-USERNAME-test.apps.CLUSTER_DOMAIN/alive quay.io/luisarizmendi/object-detection-action:prodTesting workflow
As part of the workshop materials, hardhats should be provided. If you don’t have one, you can use a cycling helmet, though this may reduce detection accuracy.
| For this initial test, you will start without wearing a hardhat. |
Once all services are up and running, follow these steps to validate the system:
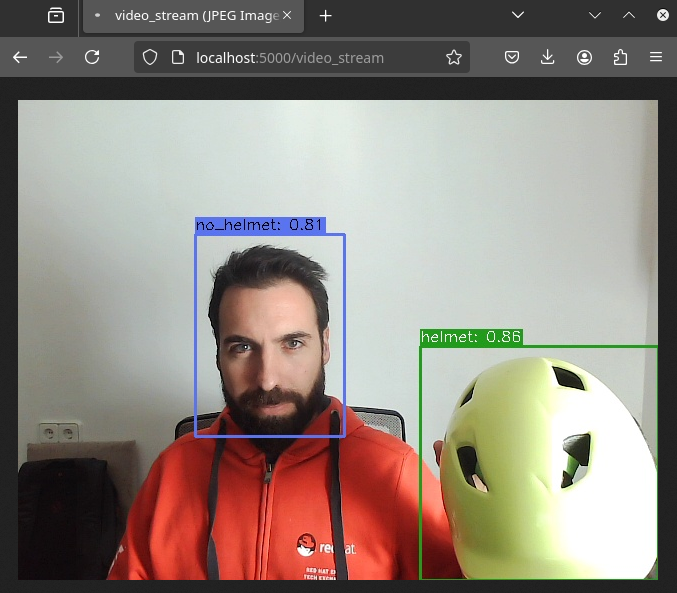
1- Open http://localhost:5000/video_stream. You should see the camera feed displaying a no_helmet detection.
2- Open the Dashboard Frontend URL. If the camera has already detected anything (helmet or no_helmet), you will see a device listed with your MAC address as the Device Name.
3- Since the camera is detecting no_helmet, an alarm icon will appear next to your device name.
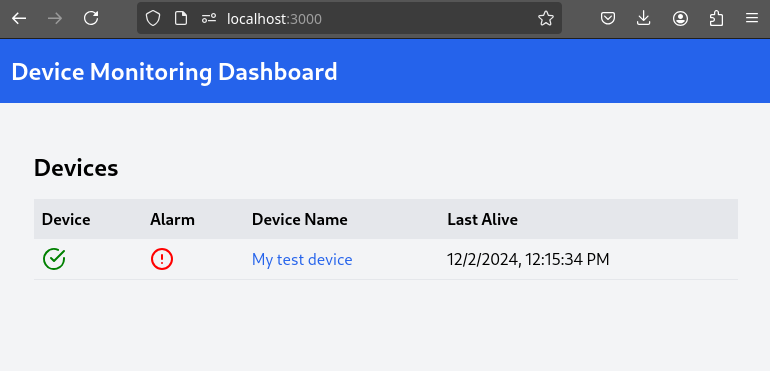
4- Put on the hardhat and observe how the system detects it in the video stream. After a few seconds, the alarm should disappear.
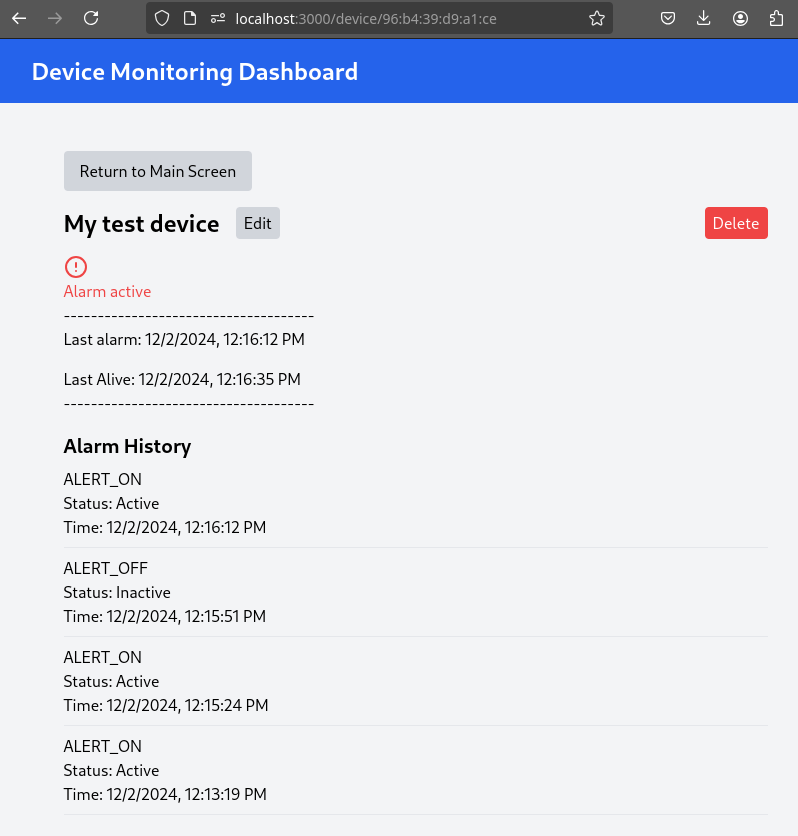
5- Click on your Device Name to view detailed information, including logged alarms. You can also rename the device to give it a more user-friendly name.
Promoting model to production

Now that you are sure that the model that you generated covers what will be needed in the field, you need to "promote" it to be used in production.
How do you promote a model to production? The approach depends on how you plan to distribute it.
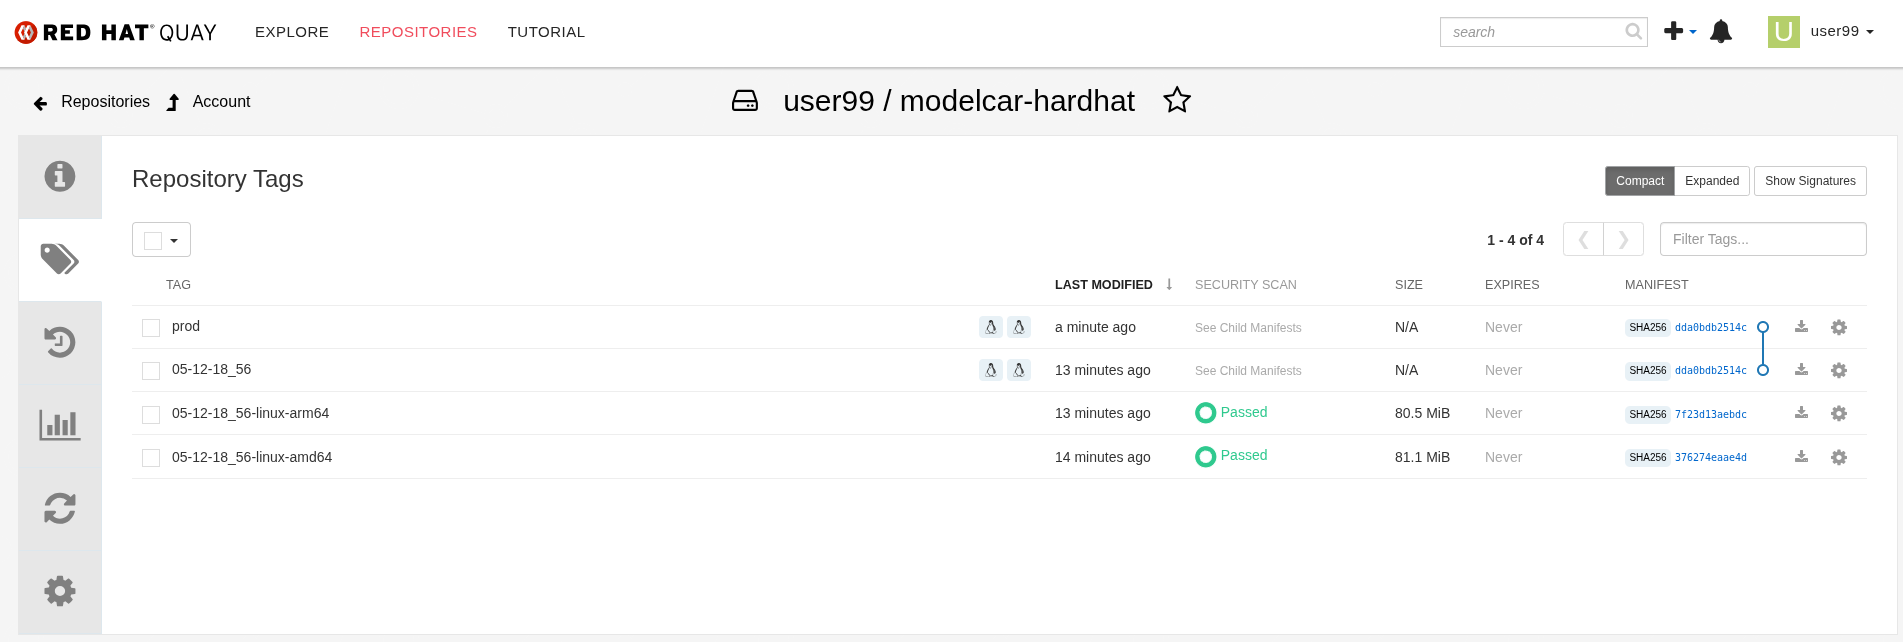
In our case, we are distributing the model as a modelcar, which is essentially a dedicated container image. Promoting the model becomes straightforward: it’s as simple as assigning the correct container image tag to the image you wish to use. For example, you can use a prod tag for the model intended for production. To do this, you’ll need to select the container image with the model you’ve just created and apply the appropriate tag. Let’s take a look at how to do this in Quay.
1- Go to Quay Container Image Registry
2- Click on the modelcar container image name
3- Click on the labels icon on the left menu
4- Look for the multiarch image that you want to "promote" and click on the gear icon on the right, then select "Add new tag"
5- Assign the prod tag to that image
Solution and Next Steps
In this step, you have completed key application development tasks, including building container images for the required applications. The code and corresponding Container files for each application can be found in the hardhat-detection-apps directory of the resources/assets resources.
At this stage, you are well-positioned to hand over the solution to the Platform Specialist for deployment on Edge Devices. However, if you prefer to skip that step or have already completed it in a previous part of the workshop, you can proceed to the final task for the AI Specialist: the Day-2 Operations section.
Throughout this module, you worked with several applications that make up the overall solution architecture. To deepen your understanding, we encourage you to explore these components further—review their source code and examine how the container images were built. You can find this additional content in the Bonus: Building the APPs module.
Do not remove the services that you deployed for your model testing since you will need it in the next section.