Day 2 Operations
As a Platform Specialist you now have under control the Edge Devices installed across the Edge perimeter and you are able to deploy new version of the Device or add Applications in a massive and declarative way thanks to Flight Control.
OS Configuration
In the case of Image Base OS, it is usually best practice to include OS-level configuration into the OS image for maximum consistency and repeatability. To update configuration, a new OS image should be created and devices updated to the new image.
However, there are scenarios where this is impractical, for example, when configuration is missing in the image, needs to be specific to a device (with its dynamically generate uuid), needs to be update-able at runtime without updating the OS image and rebooting or if it contains secrets or keys that you might not want to publish with the Image. For these cases, Flight Control allows users to declare a set of configuration files that shall be present on the device’s file system.
Conceptually, this set of configuration files can be thought of as an additional, dynamic layer on top of the OS image’s layers. The Flight Control Agent applies updates to this layer transactionally, ensuring that either all files have been successfully updated in the file system or have been returned to their pre-update state. Further, if the user updates both a devices OS and configuration set at the same time, the Flight Control Agent will first update the OS, then apply the specified configuration set on top.
After the Flight Control Agent has updated the configuration on disk, this configuration still needs to be activated. That means, running services need to reload the new configuration into memory for it to become effective. If the update involves a reboot, services will be restarted by systemd in the right order with the new configuration automatically. If the update does not involve a reboot, many services can detect changes to their configuration files and automatically reload them. When a service does not support this, you use Device Lifecycle Hooks to specify rules like "if configuration file X has changed, run command Y".
Users can specify a list of configurations sets, in which case the Flight Control Agent applies the sets in sequence and on top of each other, such that in case of conflict the "last one wins".
Configuration can come from multiple sources, called "configuration providers" in Flight Control. Flight Control currently supports the following configuration providers:
-
Git Config Provider: Fetches device configuration files from a Git repository.
-
Kubernetes Secret Provider: Fetches a Secret from a Kubernetes cluster and writes its content to the device’s file system.
-
HTTP Config Provider: Fetches device configuration files from an HTTP(S) endpoint.
-
Inline Config Provider: Allows specifying device configuration files inline in the device manifest without querying external systems.
What we would need to add in this case in terms of configuration, is the pull-secret for Microshift that will be placed under /etc/crio/openshift-pull-secret.
You can see how to get your pull-secret in this page
|
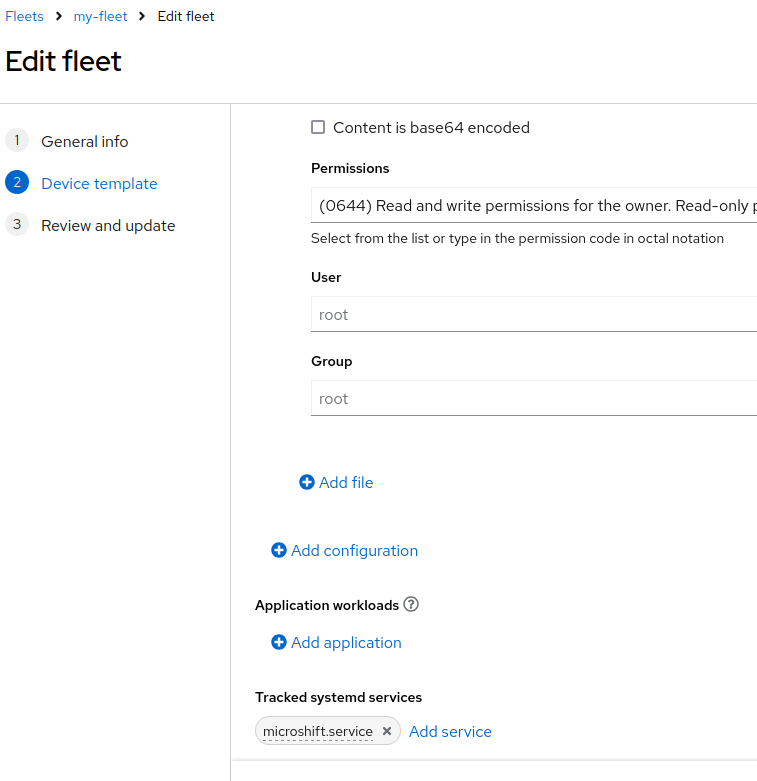
Since the Device is managed under a Fleet, we would need to update the Fleet template to include this configuration file (you might also want to add more labels to select for example only the Devices that include Microshift for this specific case).
We can decide to proceed through the CLI (from your Workstations) or GUI
$ flightctl get fleet/my-fleet -o yaml > fleet.yaml

apiVersion: v1alpha1
kind: Fleet
metadata:
  labels:
    env: test
  name: my-fleet
spec:
  selector:
    matchLabels:
      gpu: "true"
      microshift: "true"
  template:
    metadata:
      labels:
        fleet: my-fleet
    spec:
      applications: []
      config:
      - inline:
        - content: {"auths":{"cloud.openshift.com":{"auth":"b3....Yw","email":"luferrar@redhat.com"}}}
          path: /etc/crio/openshift-pull-secret
        name: pull-secret
and apply the above
$ flightctl apply -f fleet.yaml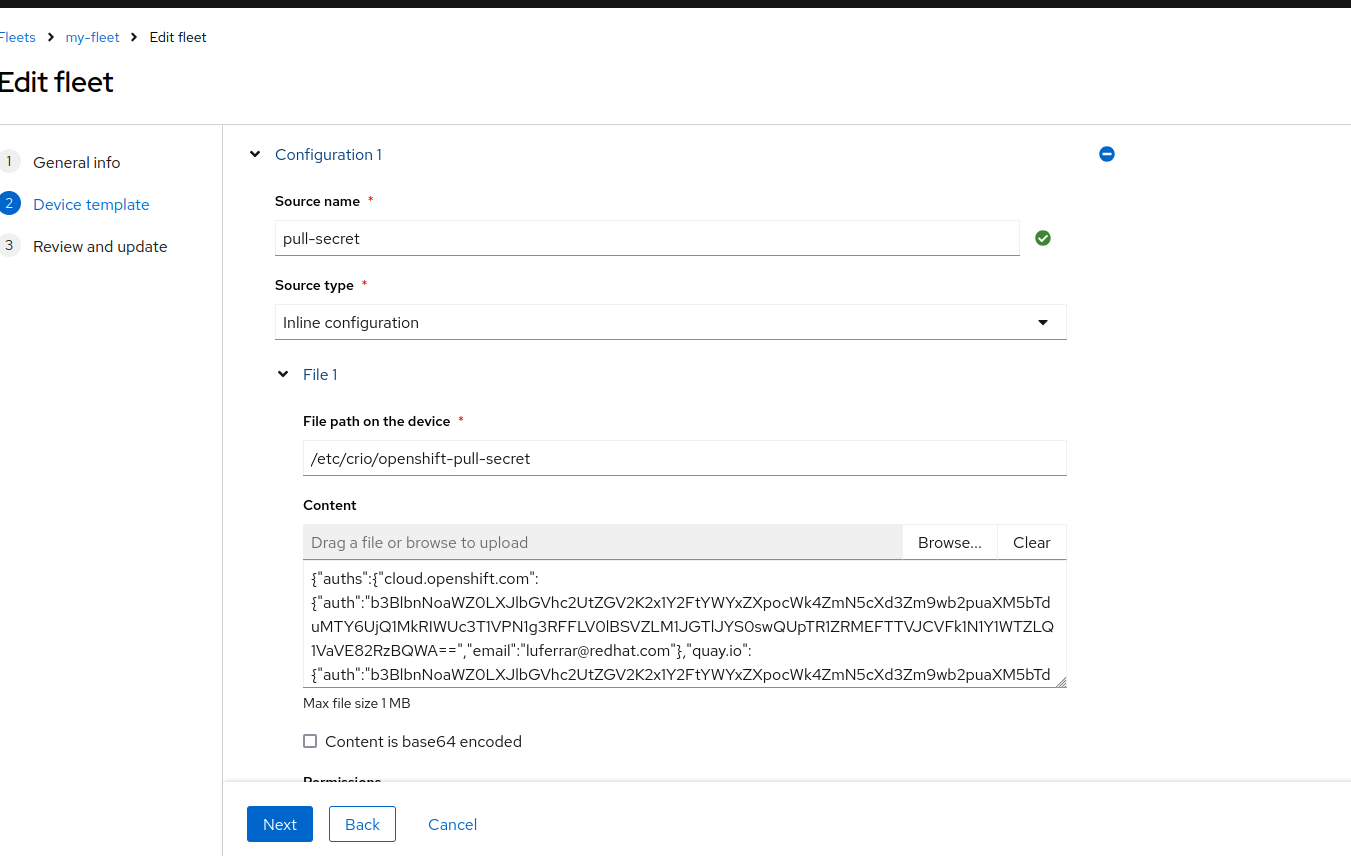
We can now start Microshift again with much more success after checking that the Local Edge Device has received the pull-secret.
$ cat /etc/crio/openshift-pull-secret
...
$ sudo systemctl enable microshift --now
After 5 to 10 minutes (downloading the container images) you should be able to see the pods running on the Local Edge Device
$ sudo oc --kubeconfig /var/lib/microshift/resources/kubeadmin/kubeconfig get pods -A

NAMESPACE                  NAME                                       READY   STATUS    RESTARTS        AGE
kube-system                csi-snapshot-controller-6885679877-k28jq   1/1     Running   0               5d1h
kube-system                csi-snapshot-webhook-896bb5c65-nqp5t       1/1     Running   0               5d1h
openshift-dns              dns-default-9fbt7                          2/2     Running   0               4m35s
openshift-dns              node-resolver-rlkm6                        1/1     Running   0               5d1h
openshift-ingress          router-default-9f776c7d-xwwhm              1/1     Running   0               5d1h
openshift-ovn-kubernetes   ovnkube-master-thcz6                       4/4     Running   1 (4m43s ago)   5d1h
openshift-ovn-kubernetes   ovnkube-node-nkrwc                         1/1     Running   1 (4m44s ago)   5d1h
openshift-service-ca       service-ca-5d57956667-m2hlc                1/1     Running   0               5d1h
openshift-storage          lvms-operator-7f544467bc-pc752             1/1     Running   0               5d1h
openshift-storage          vg-manager-pqdvr                           1/1     Running   0               3m27s
Now that Microshift is up and running you might want to also monitor the status of this specific service across your Fleet.
We are now ready to deploy the Applications!
Application deployment
You can deploy, update, or undeploy applications on a device by updating the list of applications in the device’s specification. The next time the agent checks in, it learns of the change in the specification, downloads any new or updated application packages and images from an OCI-compatible registry, and deploys them to the appropriate application runtime or removes them from that runtime.
At the moment the following runtimes and formats are supported:
-
Podman: podman-compose
-
Podman: Quadlet
-
MicroShift: Kubernetes manifests
Let’s recap for a minute, before deploying anything, what we would like the final application workflow to be.
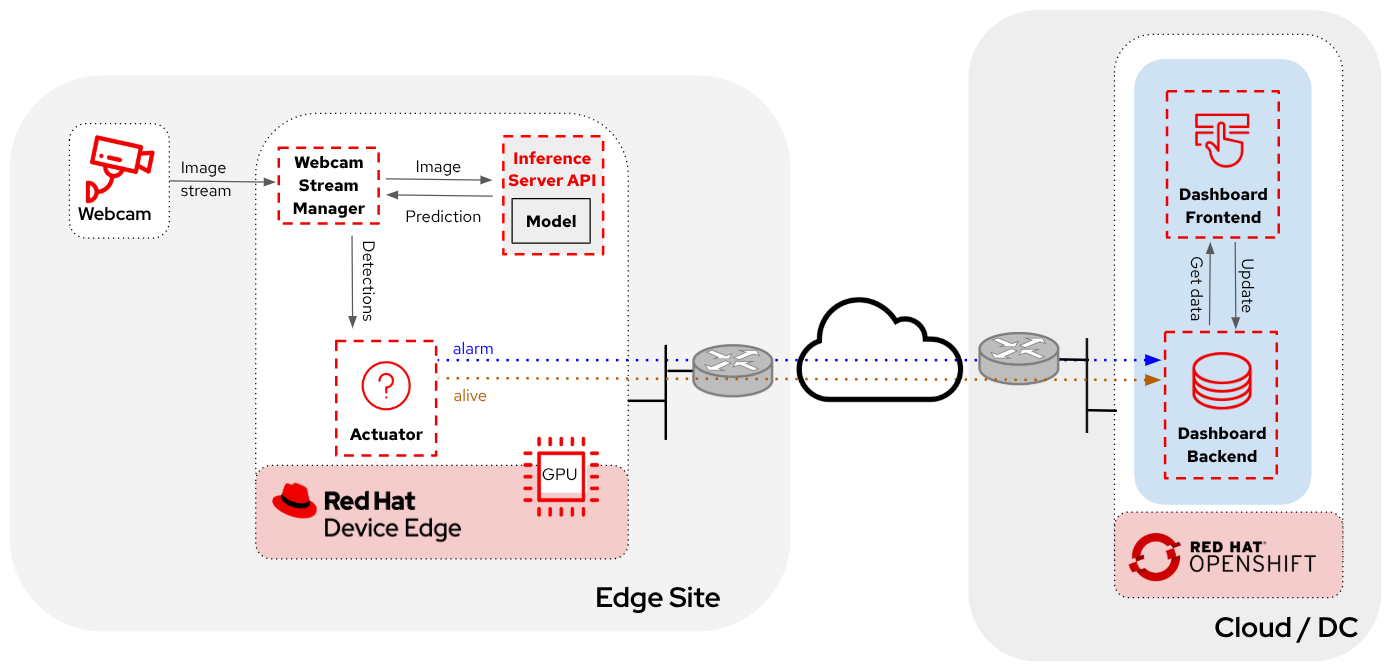
On the local Nvidia Edge Device we should be running:
-
Inference Server app
-
Camera Stream Manager app
-
Actuator app
In the Cloud, on OpenShift Cluster:
-
Dashboard Backend app
-
Dashboard Frontend app
Assuming you haven’t deployed that in the AI Specialist App Deployment we will start with the Cloud deployment since we would need the URL of the Cloud App to receive the notification from the alert app on the Edge.
Cloud Applications
You can follow these steps from your Workstation:
-
Create a new OpenShift Project (
USERNAME—test) -
Deploy the backend using the following YAML manifests (you can use the
+icon on the top right corner of the OpenShift Console to paste them)apiVersion: apps/v1 kind: Deployment metadata: name: object-detection-dashboard-backend labels: app: object-detection-dashboard app.kubernetes.io/part-of: Dashboard app.openshift.io/runtime: "python" spec: replicas: 1 selector: matchLabels: app: object-detection-dashboard component: backend template: metadata: labels: app: object-detection-dashboard component: backend spec: containers: - name: backend image: quay.io/luisarizmendi/object-detection-dashboard-backend:v1 ports: - containerPort: 5005 --- apiVersion: v1 kind: Service metadata: name: object-detection-dashboard-backend labels: app: object-detection-dashboard spec: selector: app: object-detection-dashboard component: backend ports: - protocol: TCP port: 5005 targetPort: 5005 type: ClusterIP --- apiVersion: route.openshift.io/v1 kind: Route metadata: name: object-detection-dashboard-backend labels: app: object-detection-dashboard spec: to: kind: Service name: object-detection-dashboard-backend port: targetPort: 5005 -
Create the frontend application. This time you cannot just copy-paste the manifests below since you will need to include in the Deployment manifest a value for the
BACKEND_API_BASE_URLenvironment variable. You can get the Backend URL if you check it in theNetworking > Routesmenu in the OpenShift Console (it will something likehttp://object-detection-dashboard-backend-user99-test.apps.cluster-hkr2j.hkr2j.sandbox1307.opentlc.com)apiVersion: apps/v1 kind: Deployment metadata: name: object-detection-dashboard-frontend labels: app: object-detection-dashboard app.kubernetes.io/part-of: Dashboard app.openshift.io/runtime: "nodejs" annotations: app.openshift.io/connects-to: '[{"apiVersion":"apps/v1","kind":"Deployment","name":"object-detection-dashboard-backend"}]' spec: replicas: 1 selector: matchLabels: app: object-detection-dashboard component: frontend template: metadata: labels: app: object-detection-dashboard component: frontend spec: containers: - name: frontend image: quay.io/luisarizmendi/object-detection-dashboard-frontend:v1 ports: - containerPort: 3000 env: - name: BACKEND_API_BASE_URL value: HERE-YOUR-BACKEND-API-BASE-URL-!!!!!!!!!!!!!!!!!!!!!!!!!!!!!!!!!!!!!!!!!!!!!!!!!!!!-DONT-FORGET-TO-COMPLETE --- apiVersion: v1 kind: Service metadata: name: object-detection-dashboard-frontend labels: app: object-detection-dashboard spec: selector: app: object-detection-dashboard component: frontend ports: - protocol: TCP port: 3000 targetPort: 3000 type: ClusterIP --- apiVersion: route.openshift.io/v1 kind: Route metadata: name: object-detection-dashboard-frontend labels: app: object-detection-dashboard spec: to: kind: Service name: object-detection-dashboard-frontend port: targetPort: 3000
Go to Routes in the "Administrator" view in the OpenShift Console and take note of the Backend and Frontend URLs.
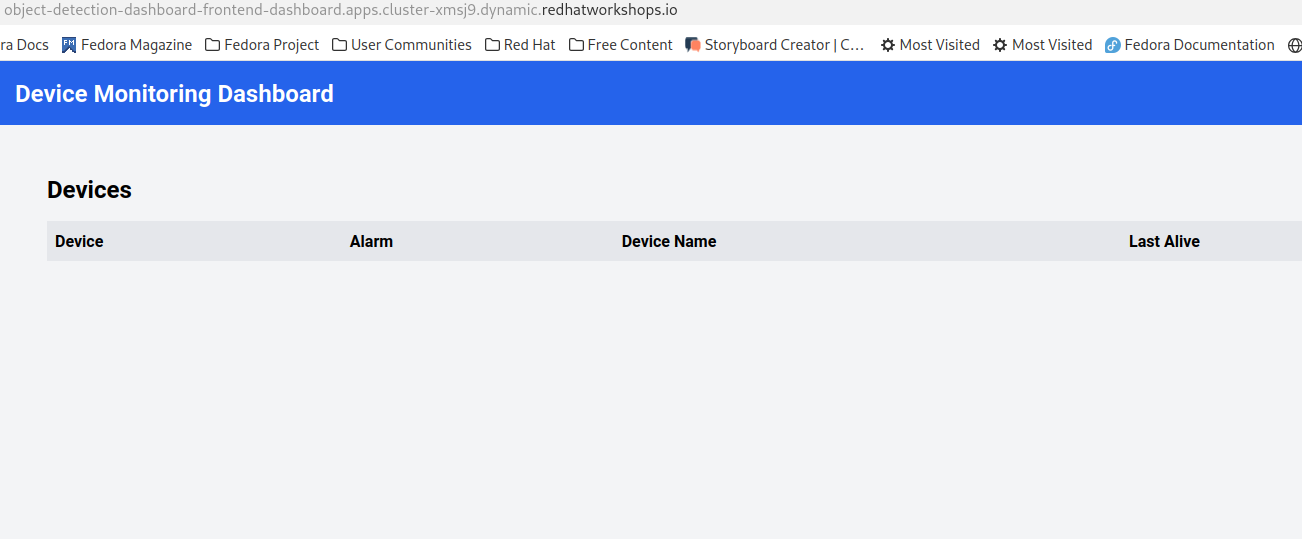
You can now test the access to the dashboard navigating to the Dashboard Frontend URL.
The Dashboard application does not use TLS, so the URL must start http:// and https:// otherwhile you will get a message "Application is not available" even when then POD is already running.
|
You should be able to see something like this navigating to the browser:
Edge Applications
To add a new application to a device, we will be modifying the Fleet Device Spec template. Given we are targeting Microshift as platform we will need to add Kubernetes manifests to the Fleet template (you can see why is that here).
So we want to apply again the logic we saw above on defining an OS config (since manifests are just configuration on the filesystem).
You will be able to find all the pre-built Edge apps in the Edge Container Registry under:
-
192.168.2.200:5000/gitea/object-detection-stream-manager:prod
-
192.168.2.200:5000/gitea/object-detection-inference-server:prod
-
192.168.2.200:5000/gitea/object-detection-action:prod
Given the kustomize files require a complex file structure, we will use the Git Config Provider option (mentioned above) in Flight Control.
You can store device configuration in a Git repository such as GitHub or GitLab and let Flight Control synchronize it to the device’s file system by adding a Git Config Provider.
The Git Config Provider takes the following parameters:
-
Repository: the name of a Repository resource defined in Flight Control.
-
TargetRevision: the branch, tag, or commit of the repository to checkout.
-
Path: the subdirectory of the repository that contains the configuration.
-
MountPath: (optional) the directory in the device’s file system to write the configuration to. Defaults to the file system root /.
The Repository resource definition tells Flight Control the Git repository to connect to and which protocol and access credentials to use. It needs to be set up once (see Setting Up Repositories) and can then be used to configure multiple devices or fleets.
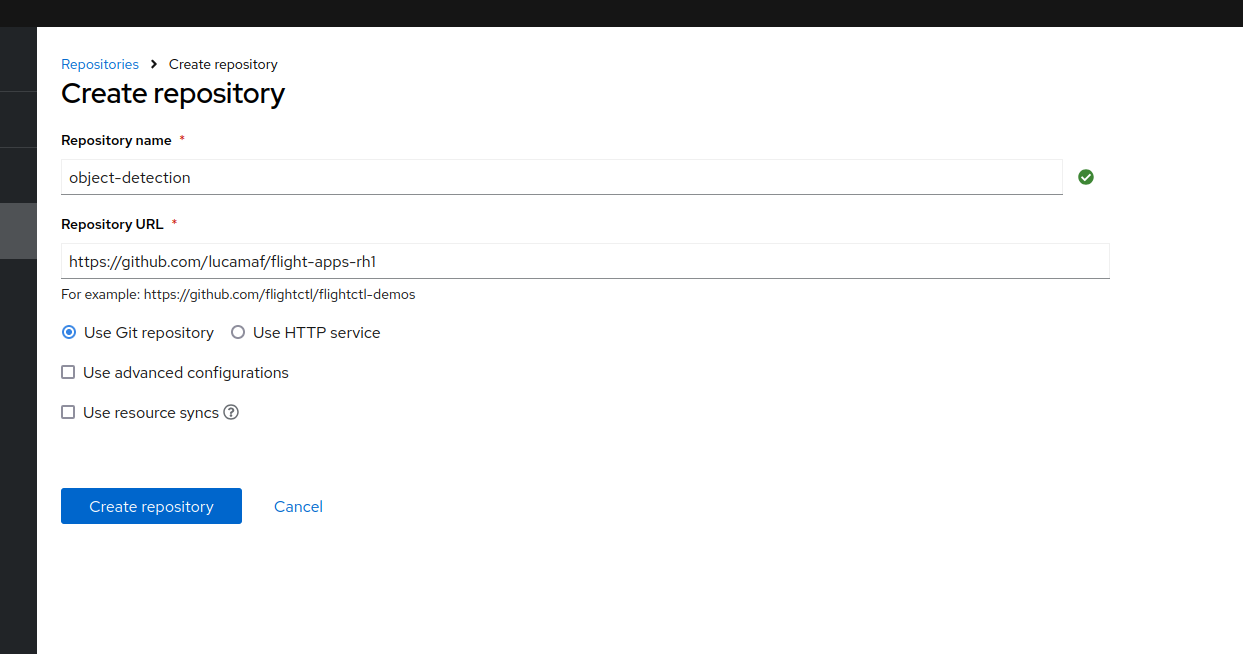
Now we can start by creating this Git repository on your Github (we would be able to also use the private Edge Container Registry if we had full control over the network, to bear in mind in case you want to store secrets inside the git repo).
You can find the full folder structure for the 3 Edge apps (and Nvidia device plugin) with kubernetes manifest files here
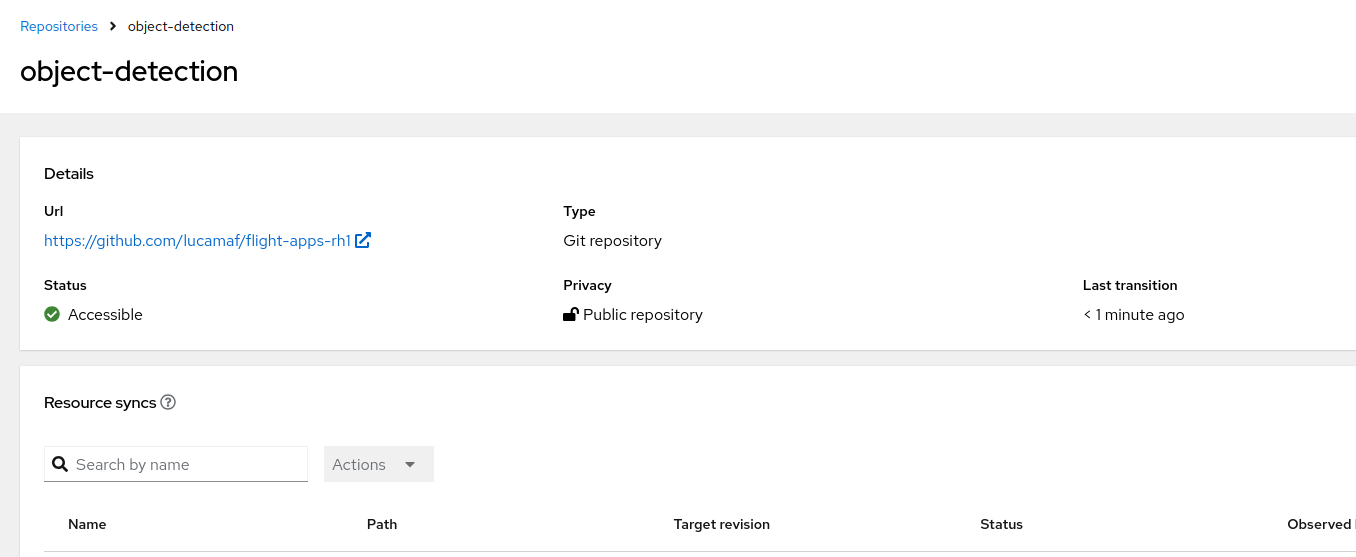
We can now define the Git repo inside Flight Control.
|
The repo that you find above needs to be forked and customized according to your own use case before being used as a source in Flight Control. Specifically you would need to change:
|
Now we can modify the Fleet template accordingly and apply the modification once again from your Workstation:
$ flightctl get fleet/my-fleet -o yaml > fleet.yaml
...
spec:
...
config:
- gitRef:
mountPath: /etc/microshift/manifests.d/
path: /
repository: object-detection
targetRevision: main
name: microshift-manifests
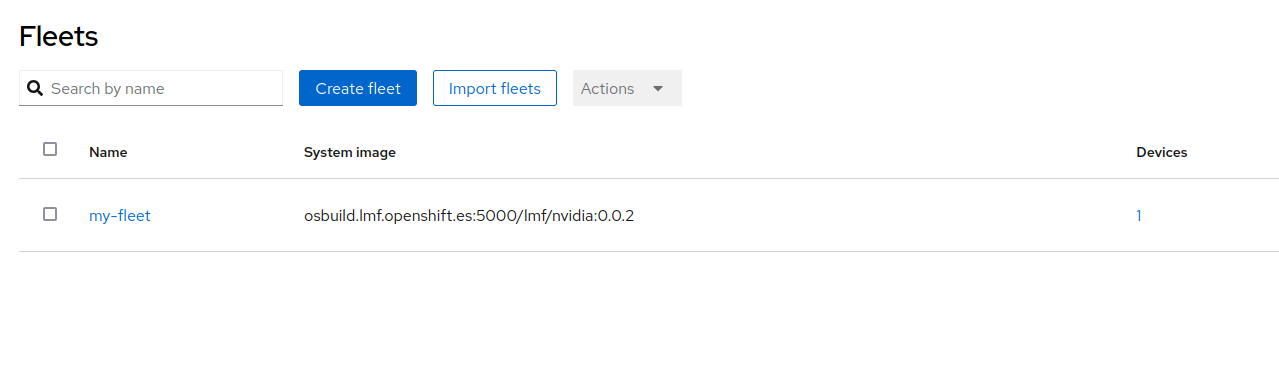
...You should now see something similar in Flight Control interface
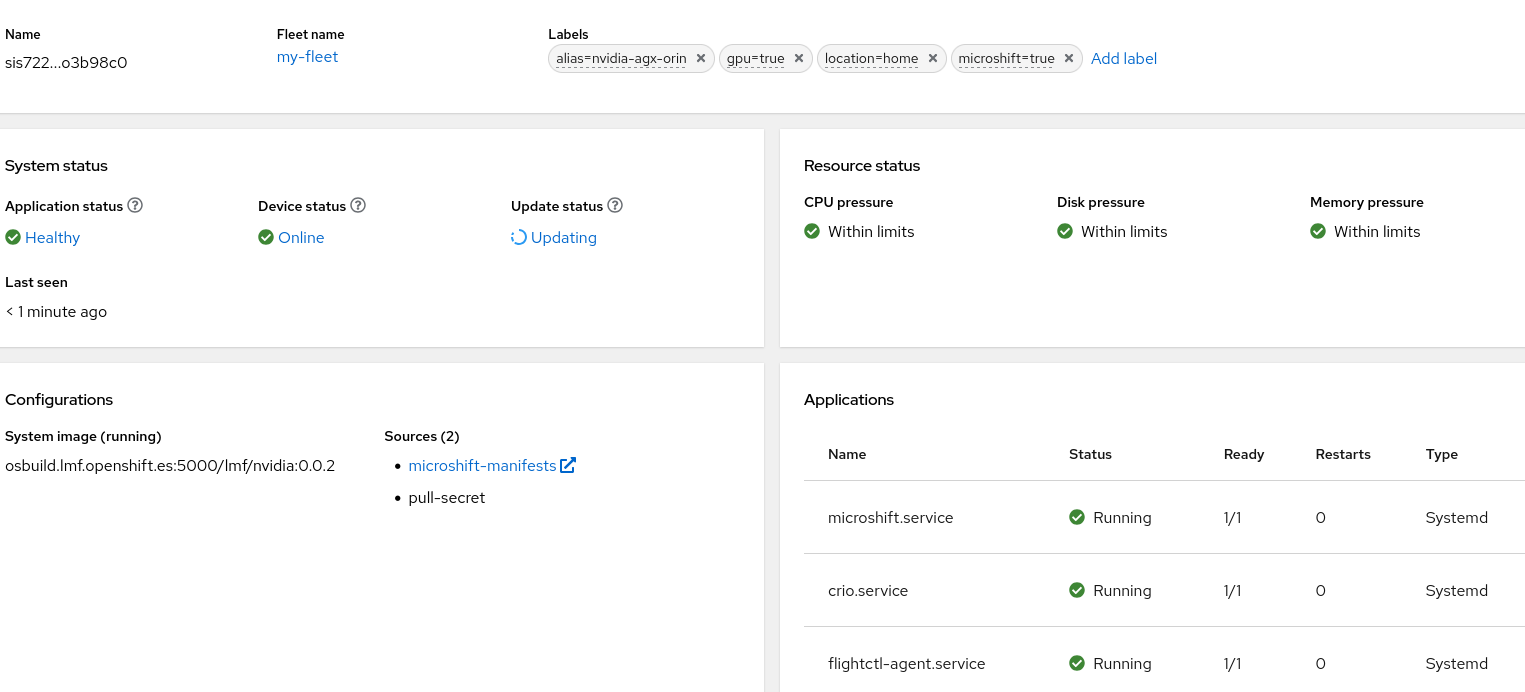
You should also see the new manifests now landed on your Edge Device (in case you don’t I suggest you restart flightctl-agent.service again)
$ sudo ls /etc/microshift/manifests.d/

action	inference-server  stream-manager nvidia
You now go ahead and restart Microshift, so that it picks up the new manifests and apply them automatically with kustomizer. And check finally if the applications are running correctly on Microshift:
$ sudo oc --kubeconfig /var/lib/microshift/resources/kubeadmin/kubeconfig get all -n object-detection

NAME                                                                READY   STATUS    RESTARTS   AGE
pod/object-detection-action-deployment-54c6b68b47-h9swt             1/1     Running   0          30m
pod/object-detection-inference-server-deployment-7f99bd57dc-vh6pm   1/1     Running   0          30m
pod/object-detection-stream-manager-deployment-5c95454654-wcpnb     1/1     Running   0          25m

NAME                                                TYPE           CLUSTER-IP      EXTERNAL-IP       PORT(S)          AGE
service/object-detection-inference-server-service   LoadBalancer   10.43.220.243   192.168.122.117   8080:31583/TCP   30m
service/object-detection-stream-manager-service     NodePort       10.43.168.194   <none>            5000:32160/TCP   30m

NAME                                                           READY   UP-TO-DATE   AVAILABLE   AGE
deployment.apps/object-detection-action-deployment             1/1     1            1           30m
deployment.apps/object-detection-inference-server-deployment   1/1     1            1           30m
deployment.apps/object-detection-stream-manager-deployment     1/1     1            1           30m

NAME                                                                      DESIRED   CURRENT   READY   AGE
replicaset.apps/object-detection-action-deployment-54c6b68b47             1         1         1       30m
replicaset.apps/object-detection-inference-server-deployment-7f99bd57dc   1         1         1       30m
replicaset.apps/object-detection-stream-manager-deployment-5c95454654     1         1         1       30m
Integrated Applications Test
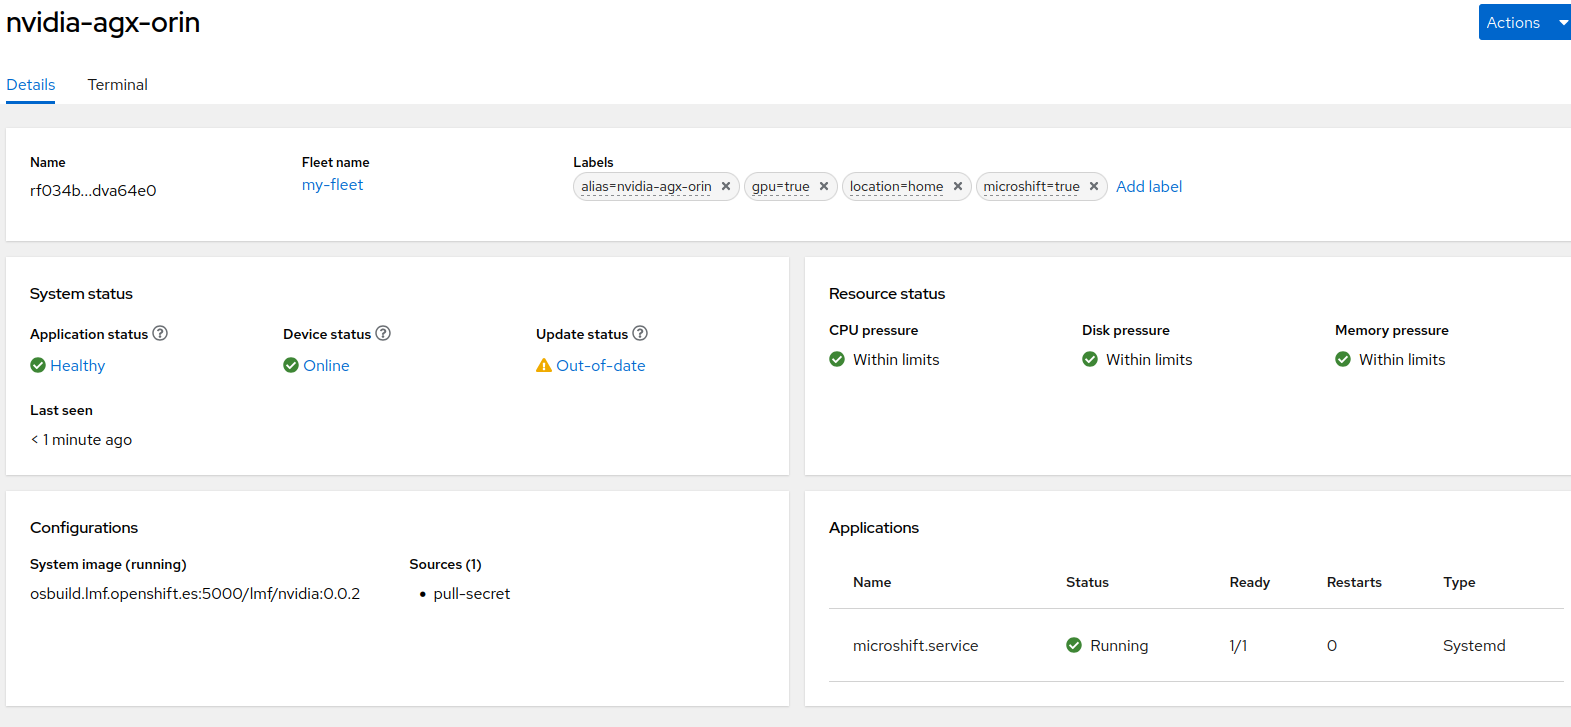
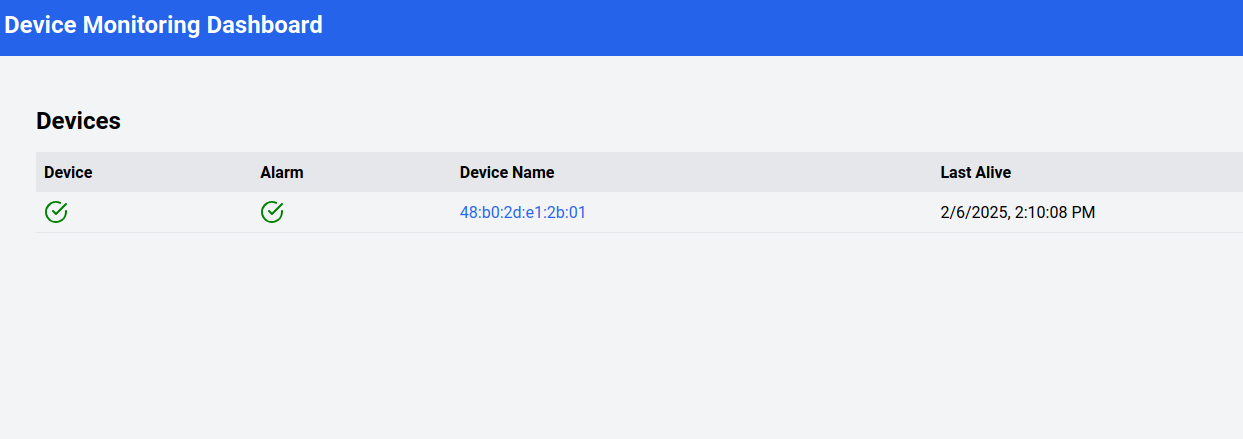
If the two previous deployments worked fine you should see a Device popping up in the Device Monitoring Dashboard like this:
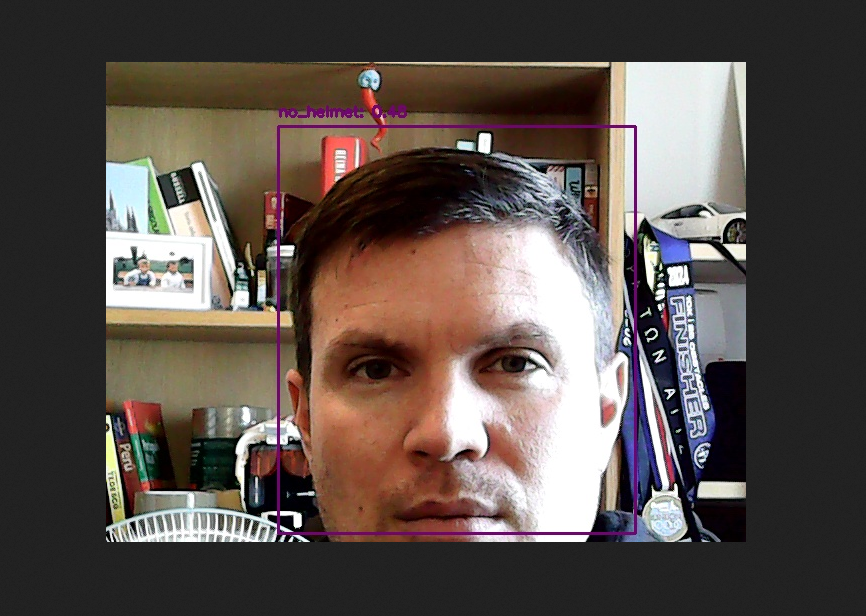
We can now interact with the Inference Server and see how the situation changes when we move the camera and focus on your face
To be able to reach the Streaming app you might need to open the related firewall port on the Local Edge Device (in this case we are opening the NodePort we defined in the stream-manager service definition):
$ sudo firewall-cmd --zone=public --add-port=32160/tcp --permanent
$ sudo firewall-cmd --reload
Now navigate to the IP of the Local Edge Device with port 32160, under the URL video_stream
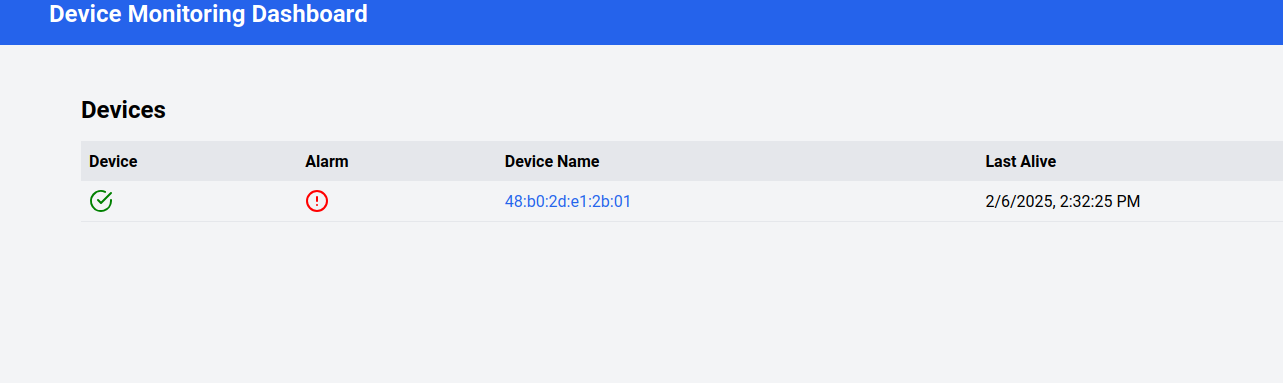
Given we are not wearing any helmet at the moment, this should be the result:
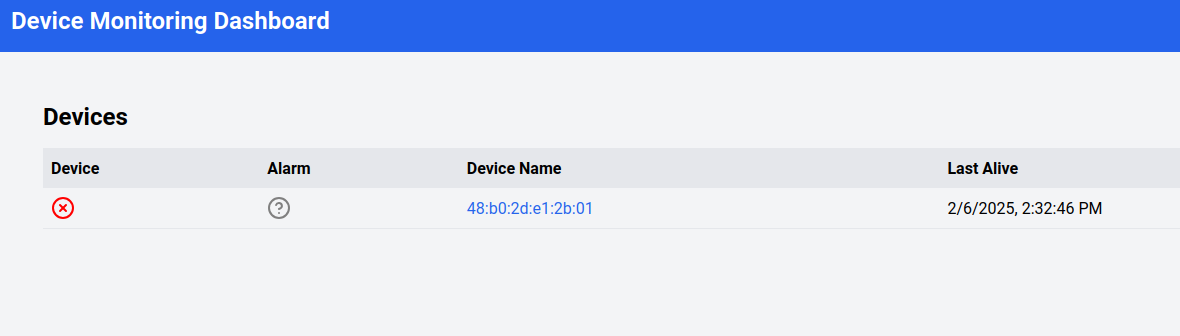
Should the Edge Device disconnect from the Cloud you should see something like this:
OS Update
You can update a device’s OS by updating the target OS image name or version in the device’s specification. The next time the agent checks in, it learns of the requested update and automatically starts downloading and verifying the new OS version in the background. It then schedules the actual system update to be performed according to the update policy. When the time has come to update, it installs the new version in parallel and performs a reboot into the new version.
In this case we are going to generate a new image that includes cockpit-ostree package, which will allow us to visualize graphically on the cockpit the update tree for the target system.
$ flightctl get fleet/my-fleet -o yaml > fleet.yaml
...
   spec:
      updatePolicy:
        downloadSchedule:
          at: "* 9-16 * * *"
        updateSchedule:
          at: "0 9 * * 5"
      applications: []
...
In this case we have decided to download updates everyday, during working hours and we are going to reboot into updated version only on Saturdays, because we know this shift is going to be covered by Ops team.
Let’s now add the required package
FROM {container-registry-gitea}/{id}/nvidia:0.0.2

RUN dnf -y install cockpit-ostree; \
    dnf -y clean all
and build and push the new image to the Local Edge Registry (again using either the Shared Edge Builder or the VM on your Local Edge Device).
$ sudo podman build -t 192.168.2.200:5000/ID/nvidia:0.0.2 .
$ sudo push  192.168.2.200:5000/ID/nvidia:0.0.2
We can now change the Fleet definition and point to the reference OS Image URL.
$ flightctl get fleet/my-fleet -o yaml > fleet.yaml
...
    spec:
      applications: []
      os:
        image: {container-registry-gitea}/{id}/nvidia:0.0.2
      config:
and wait for the agent to take care of downloading the new image.
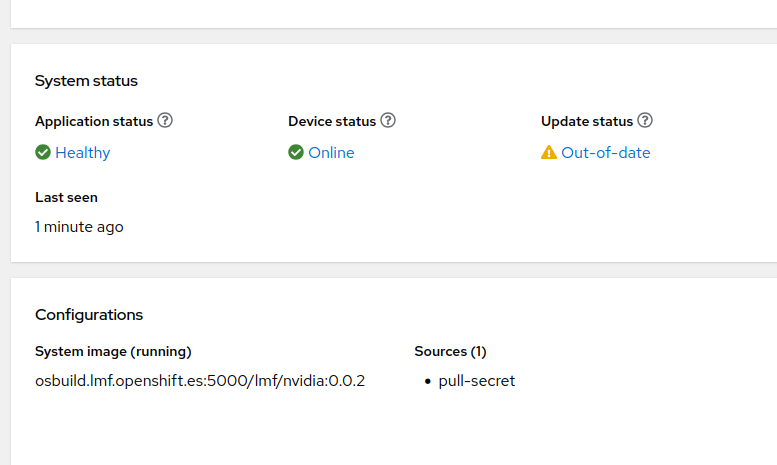
You should also be able to see that happening in the Dashboard.
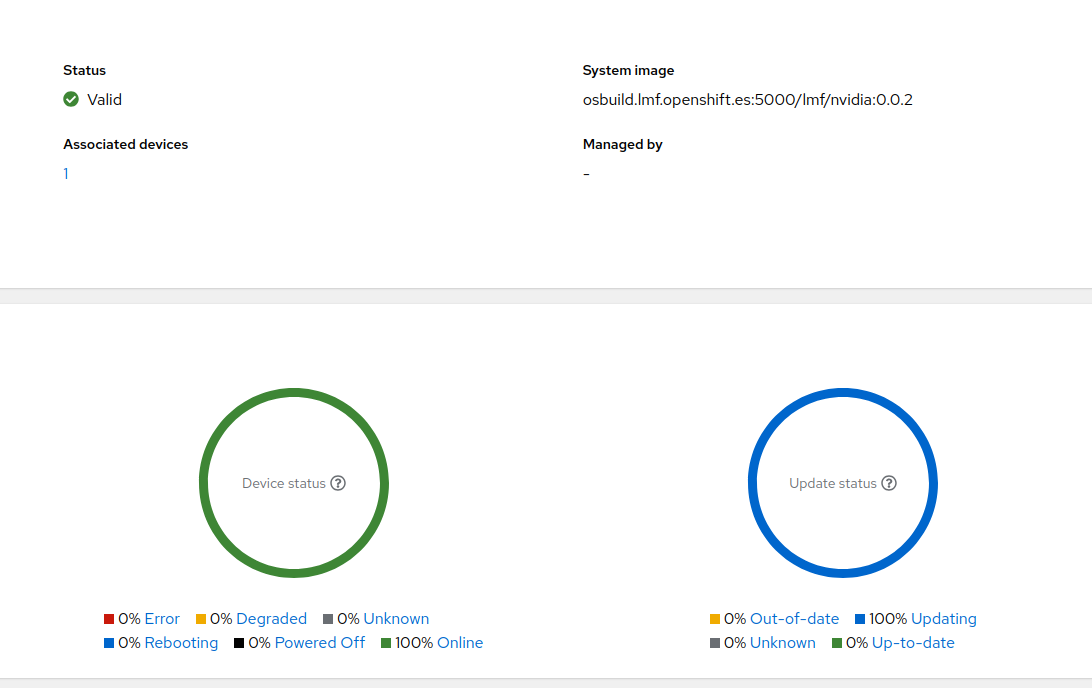
Mind you, it might take a while for the agent to download the image (should the agent timeout, you can restart the service easily with systemctl restart flightctl-agent.service). After a while you should see the Device is ready for reboot.
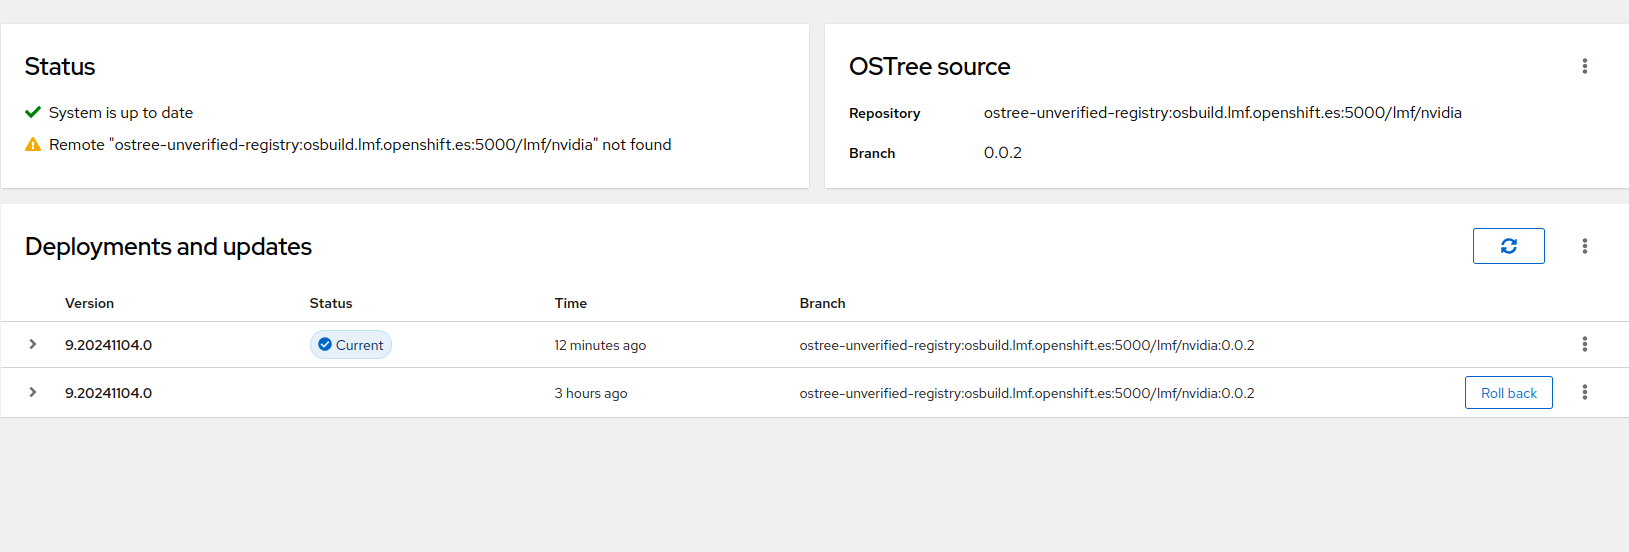
which we will trigger manually. After that you should be able to see a new section inside cockpit.
SELINUX might be blocking your cockpit interface, you can temporarily disable it with setenforce 0
|
Device Monitoring
One important element of Edge Device is preventive monitoring and maintenance, since most of them are really remote and losing one of them without previous notice might imply losing visibility on a whole remote site.
You can set up monitors for device resources and define alerts when the utilization of these resources crosses a defined threshold in Flight Control. When the agent alerts the Flight Control service, the service sets the device status to "degraded" or "error" (depending on the severity level) and may suspend the rollout of updates and alert the user as a result.
Note this is not meant to replace an observability solution.
Resource monitors take the following parameters:
-
MonitorType: the resource to monitor. Currently supported resources are "CPU", "Memory", and "Disk".
-
SamplingInterval the interval in which the monitor samples utilization, specified as positive integer followed by a time unit ('s' for seconds, 'm' for minutes, 'h' for hours).
-
AlertRules: a list of alert rules.
-
Path: (Disk monitor only) the absolute path to the directory to monitor. Utilization reflects the filesystem containing the path, similar to df, even if it’s not a mount point.
Alert rules take the following parameters:
-
Severity: the alert rule’s severity level out of "Info", "Warning", or "Critical". Only one alert rule is allowed per severity level and monitor.
-
Duration: the duration that resource utilization is measured and averaged over when sampling, specified as positive integer followed by a time unit ('s' for seconds, 'm' for minutes, 'h' for hours). Must be smaller than the sampling interval.
-
Percentage: the utilization threshold that triggers the alert, as percentage value (range 0 to 100 without the "%" sign).
-
Description: a human-readable description of the alert. This is useful for adding details about the alert that might help with debugging
We are going to add a simple CPU monitor to the local Nvidia Device and make sure that threshold is so low that it triggers alerts. But first let’s examine the Device definition inside Flight Control.
$ flightctl get device/cfq3nqurpqqhc91rs4sunh4a133dg3rlnntq9r7kfqr61rtmud60 -o yaml

apiVersion: v1alpha1
kind: Device
metadata:
  annotations:
    device-controller/renderedVersion: "6"
    fleet-controller/renderedTemplateVersion: "2025-01-31T11:05:54.073774434Z"
    fleet-controller/templateVersion: "2025-01-31T11:05:54.073774434Z"
  creationTimestamp: "2025-01-31T10:41:41.451373Z"
  generation: 2
  labels:
    alias: nvidia-agx-vm
    gpu: "true"
    location: home
  name: cfq3nqurpqqhc91rs4sunh4a133dg3rlnntq9r7kfqr61rtmud60
  owner: Fleet/my-fleet
  resourceVersion: "64"
spec:
  applications: []
  config: []
  os:
    image: osbuild.lmf.openshift.es:5000/lmf/nvidia:0.0.2
status:
  applications: []
  applicationsSummary:
    info: No application workloads are defined.
    status: Healthy
  conditions:
  - lastTransitionTime: "2025-01-31T10:43:55.27613807Z"
    message: 'Updated to desired renderedVersion: 2'
    reason: Updated
    status: "False"
    type: Updating
  - lastTransitionTime: "2025-01-31T10:41:41.498099133Z"
    message: ""
    reason: Valid
    status: "True"
    type: SpecValid
  config:
    renderedVersion: "2"
  integrity:
    summary:
      status: ""
  lastSeen: "2025-01-31T10:44:54.403698984Z"
  lifecycle:
    status: Unknown
  os:
    image: osbuild.lmf.openshift.es:5000/lmf/nvidia:0.0.2
    imageDigest: sha256:cf1221f4fc7d3618be3542fa5f55d4495c499d59b22a60c8c6ee64c7645a167f
  resources:
    cpu: Healthy
    disk: Healthy
    memory: Healthy
  summary:
    info: Did not check in for more than 5 minutes
    status: Unknown
  systemInfo:
    architecture: arm64
    bootID: |
      3aac7f9e-2998-452e-bfc4-a1728914d279
    operatingSystem: linux
  updated:
    info: The device has been updated to the latest device spec.
    status: UpToDate
As we can see in the Status, the Resources are all healthy (CPU, Disk, Memory).
Since the Device is managed inside a Fleet we would need to update the Fleet template
$ flightctl get fleet/my-fleet -o yaml > fleet.yamlWe can include a simple monitoring snippet
      resources:
      - alertRules:
        - description: CPU Usage high, check for running processes!
          duration: 10m
          percentage: 1
          severity: Warning
        monitorType: CPU
        samplingInterval: 5s
and apply the modified yaml configuration again
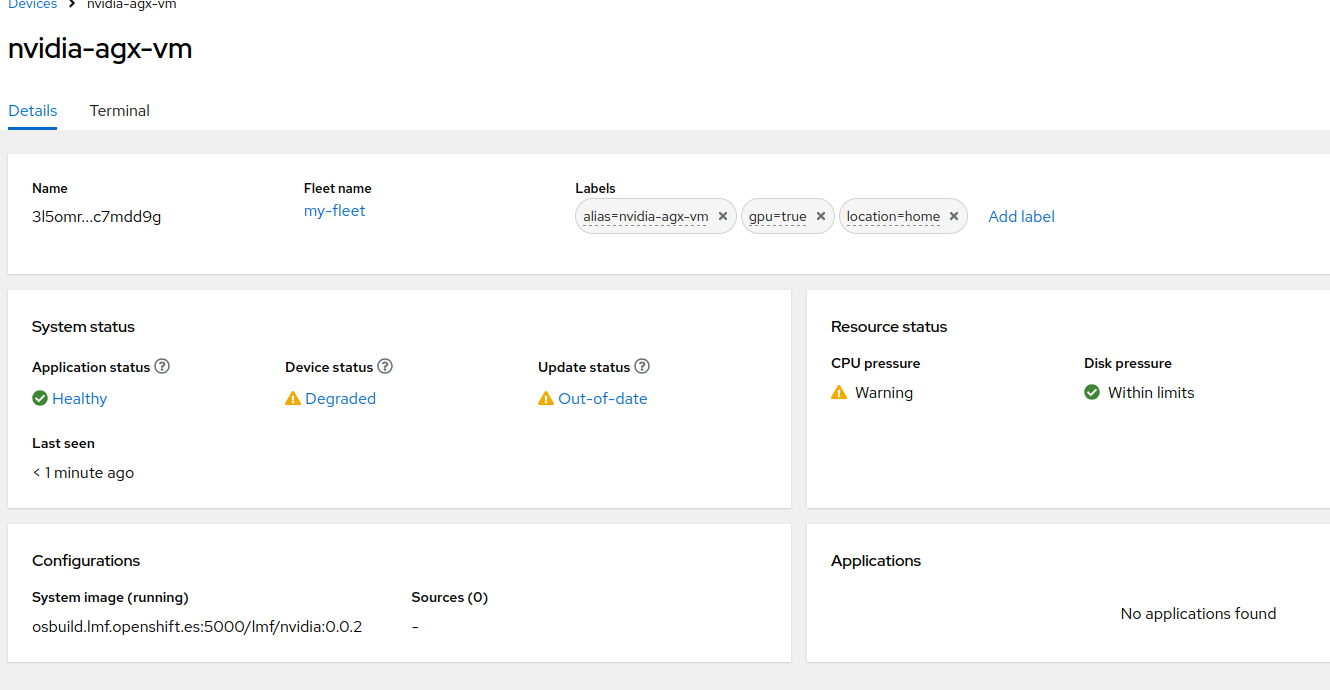
$ flightctl apply -f fleet.yamlYou should now see something changing in the Resource status section
Move back to Index