Fast-Track Instructions
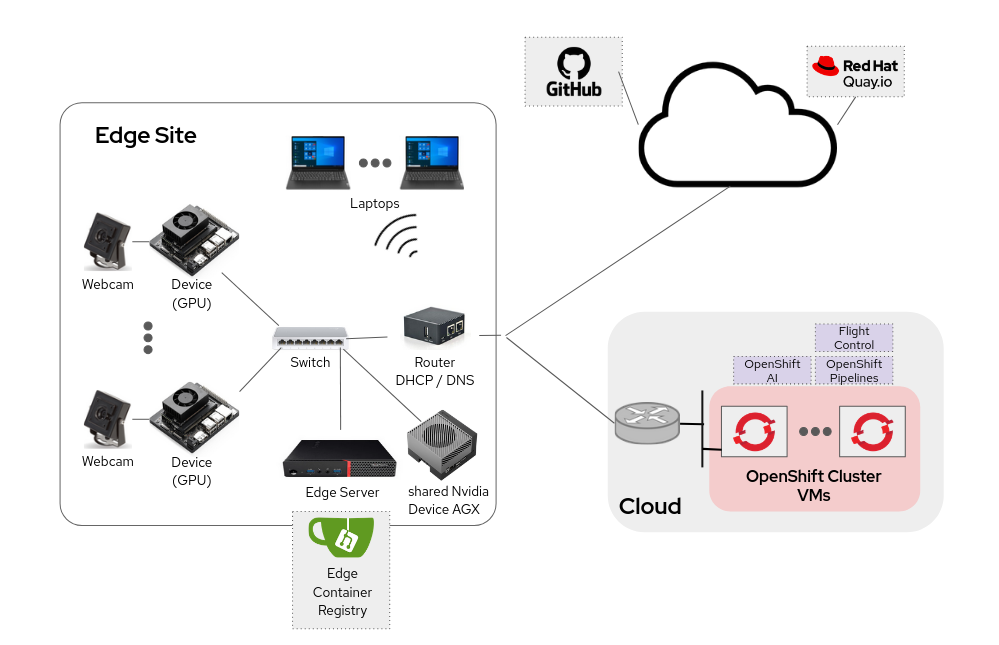
Your mission is to develop an object detection system that monitors workers in real time, identifying whether they’re wearing hardhats. The system will rely on existing USB webcams across the factory floor, feeding video streams into AI models deployed on industrial PCs (IPCs) equipped with NVIDIA GPUs.
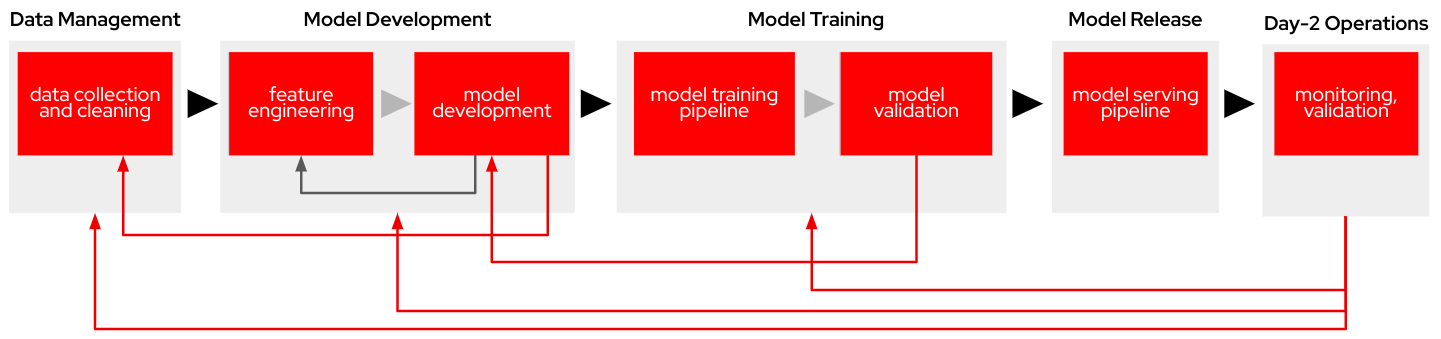
Find below the workflow that you will follow as AI specialist during the workshop.
Let’s start with the first step.
1. Data Management
| You have the full guide for this task in the Data Management section |
For this project, Roboflow will be the primary tool used for managing and preparing data.
Your first task will be to create a Roboflow account (if you don’t have one already):
-
Go to https://roboflow.com/ and click
Get Startedin the top-right corner. -
Choose your preferred sign-up method (such as email) and enter your name and password.
-
You’ll be prompted to create a new workspace, use "workshop" as name. This will serve as the central hub for organizing datasets and projects.
-
Do not create a "Project" becase you are going to fork a Dataset and it will create a new Project for you.
| Roboflow includes some restrictions to Not-Paid accounts. The most important for us is that the overall number of images in your account must be less than 10,000, so we need to mantain the size of the Dataset that we will create in the next point below that number. |
You will get images in your Roboflow account by forking another Project.
To Fork the "Hardhat or Hat MockTrain" Project:
-
Navigate to the dataset’s URL that you want to Fork in Roboflow Universe.
-
Click the "Fork Dataset" button on the top right corner.
-
Confirm and wait until fork is done.
| It is named 'MockTrain' because it contains only a few images to speed up training during the workshop. However, the resulting model will not be usable. A pre-trained model, trained on a more comprehensive dataset Hardhat or Hat, will be provided as part of this workshop . |
Roboflow need you to "publish" the Dataset to be trained by creating a "version".
To create a new version of your Dataset:
-
Navigate to your Project’s URL in your Roboflow account.
-
Click on "Versions" in the left menu.
-
You’ll be prompted to apply additional preprocessing and aumentation actions. You won’t include any so click "Continue" twice.
-
Click "Create".
Now is time to get the details to access this Dataset version. You don’t need to download the files, the images and metadata will be directly gather from Roboflow in this workshop.
To get the Dataset access details:
-
Navigate to the Project’s URL in your Roboflow account.
-
Click the "Versions" on the left menu and select the version to be used (you have just one).
-
Click on "Download Dataset" on top right corner.
-
Select the format. We will be using a YOLOv11 based model.
-
Select "Show download code" radio button.
-
Unselect "Also train" option if it appears as an option.
-
Click "Continue".
-
You get a piece of code for Jupyter, copy it because you will need them later (you don’t need to press the button, just copy the text). The generated code will be similar to the shown below.
!pip install roboflow

from roboflow import Roboflow
rf = Roboflow(api_key="xxxxxxxxxxxxxxxxxxxxx")
project = rf.workspace("workspace").project("hardhat-or-hat-mocktrain-<xxxxxxx>")
version = project.version(1)
dataset = version.download("yolov11")
Ok, you have your Dataset ready to be used, move into the next task.
2. Model Development
| You have the full guide for this task in the Model Development section |
This section will guide you through the essential steps of engineering, training, and evaluation to create the first model prototype.
In this step you will be using OpenShift AI and OpenShift Data Foundation.
OpenShift AI is an integrated platform that simplifies the development and deployment of AI workloads. We will use it to create and manage the Jupyter Notebooks for experimentation and model training.
OpenShift Data Foundation is an Open Source High Performance Object Storage where we will save the models and the files with the performance metrics.
To get started, you will create a new, empty Jupyter Notebook using OpenShift AI. In order to do so you have to
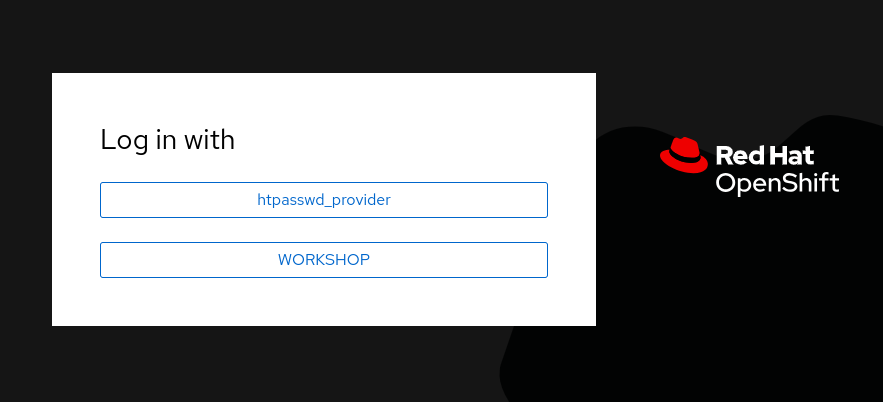
2- Log in using your OpenShift credentials: USERNAME / PASSWORD. It’s a good idea to refresh the page right after the first log in in order to let the left menu load completly with all the additional enabled features.
You need to select the WORKSHOP authenticaticator
3- Open the Data Science Project "USERNAME-ai".
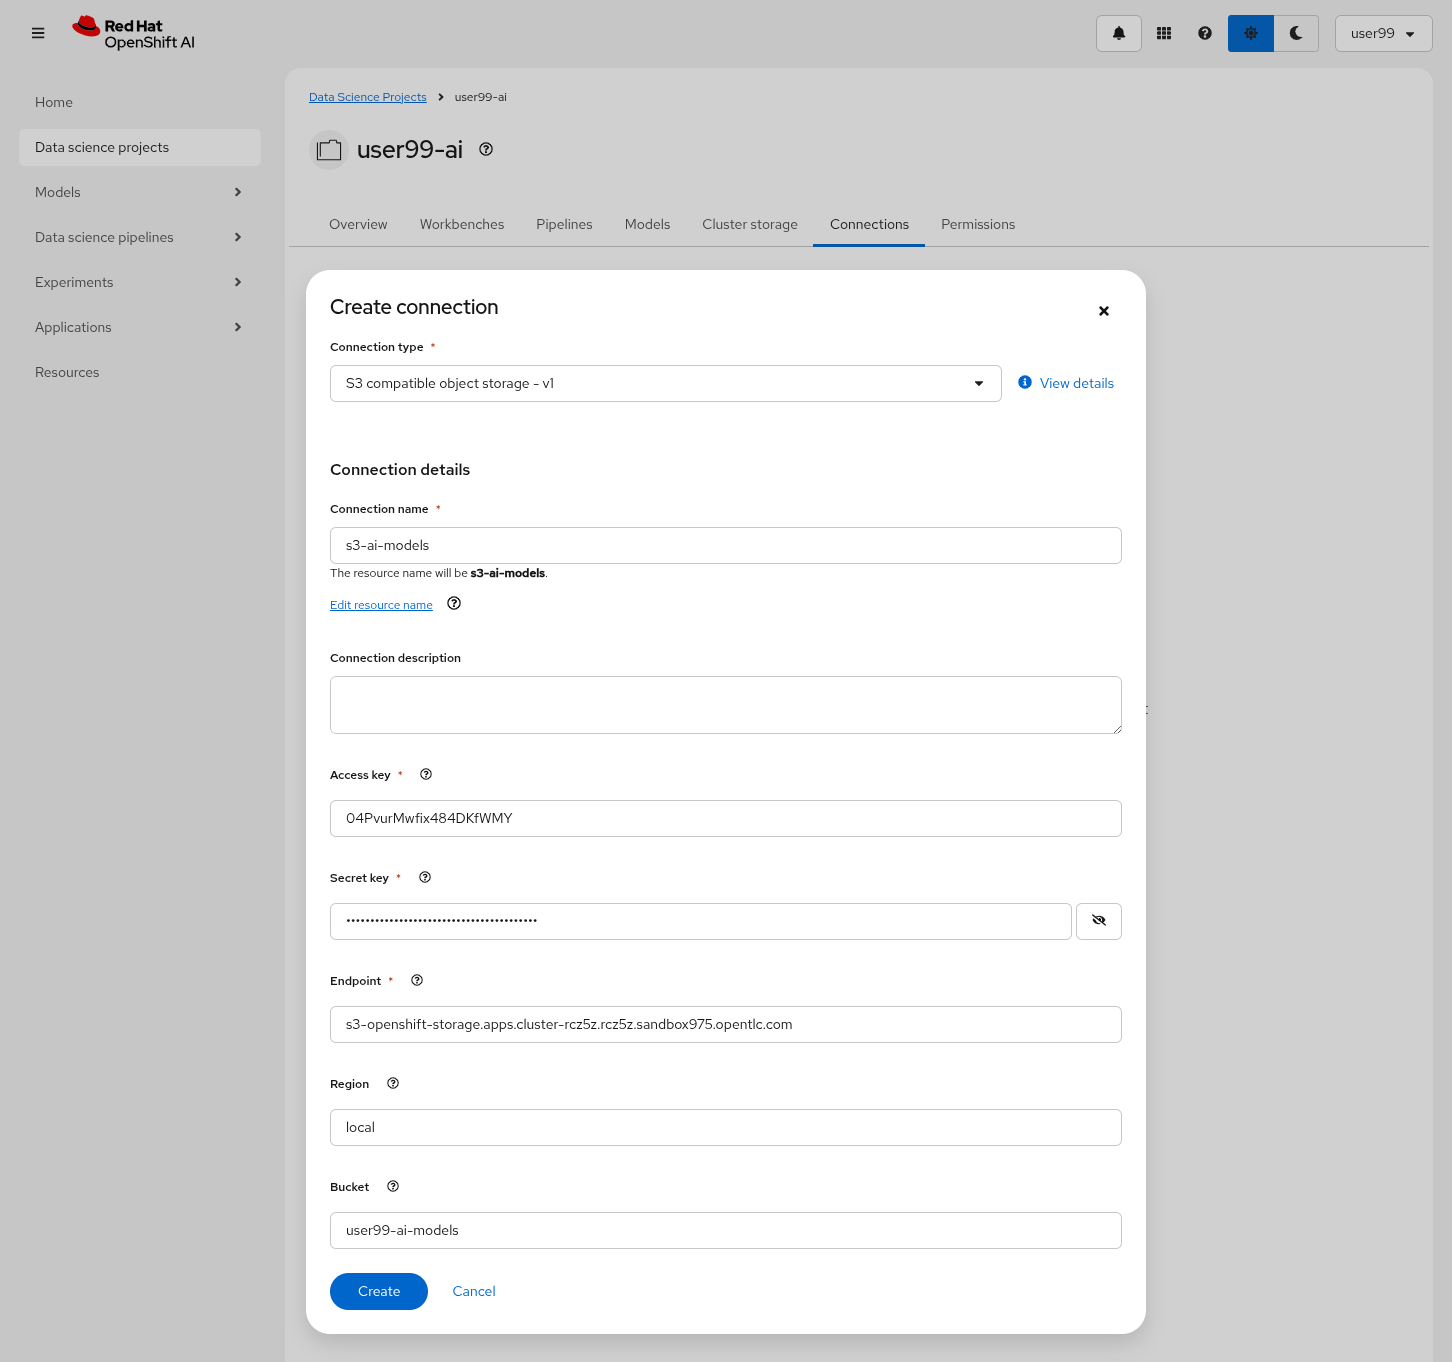
4- Create a new S3 Storage Connection ("Connetions" tab) that will be used by your Jupyter Notebooks to save the model and performance stats. Include:
-
Name for the S3 connection: We suggest using
s3-ai-models -
Access key:
OBJECT_STORAGE_MODELS_ACCESS_KEY -
Secret key:
OBJECT_STORAGE_MODELS_SECRET_KEY -
Endpoint:
s3-openshift-storage.apps.CLUSTER_DOMAIN -
Region: You can keep the Region. If it is empty but it’s better to include any string (e.g.
local). -
Bucket:
USERNAME-ai-models
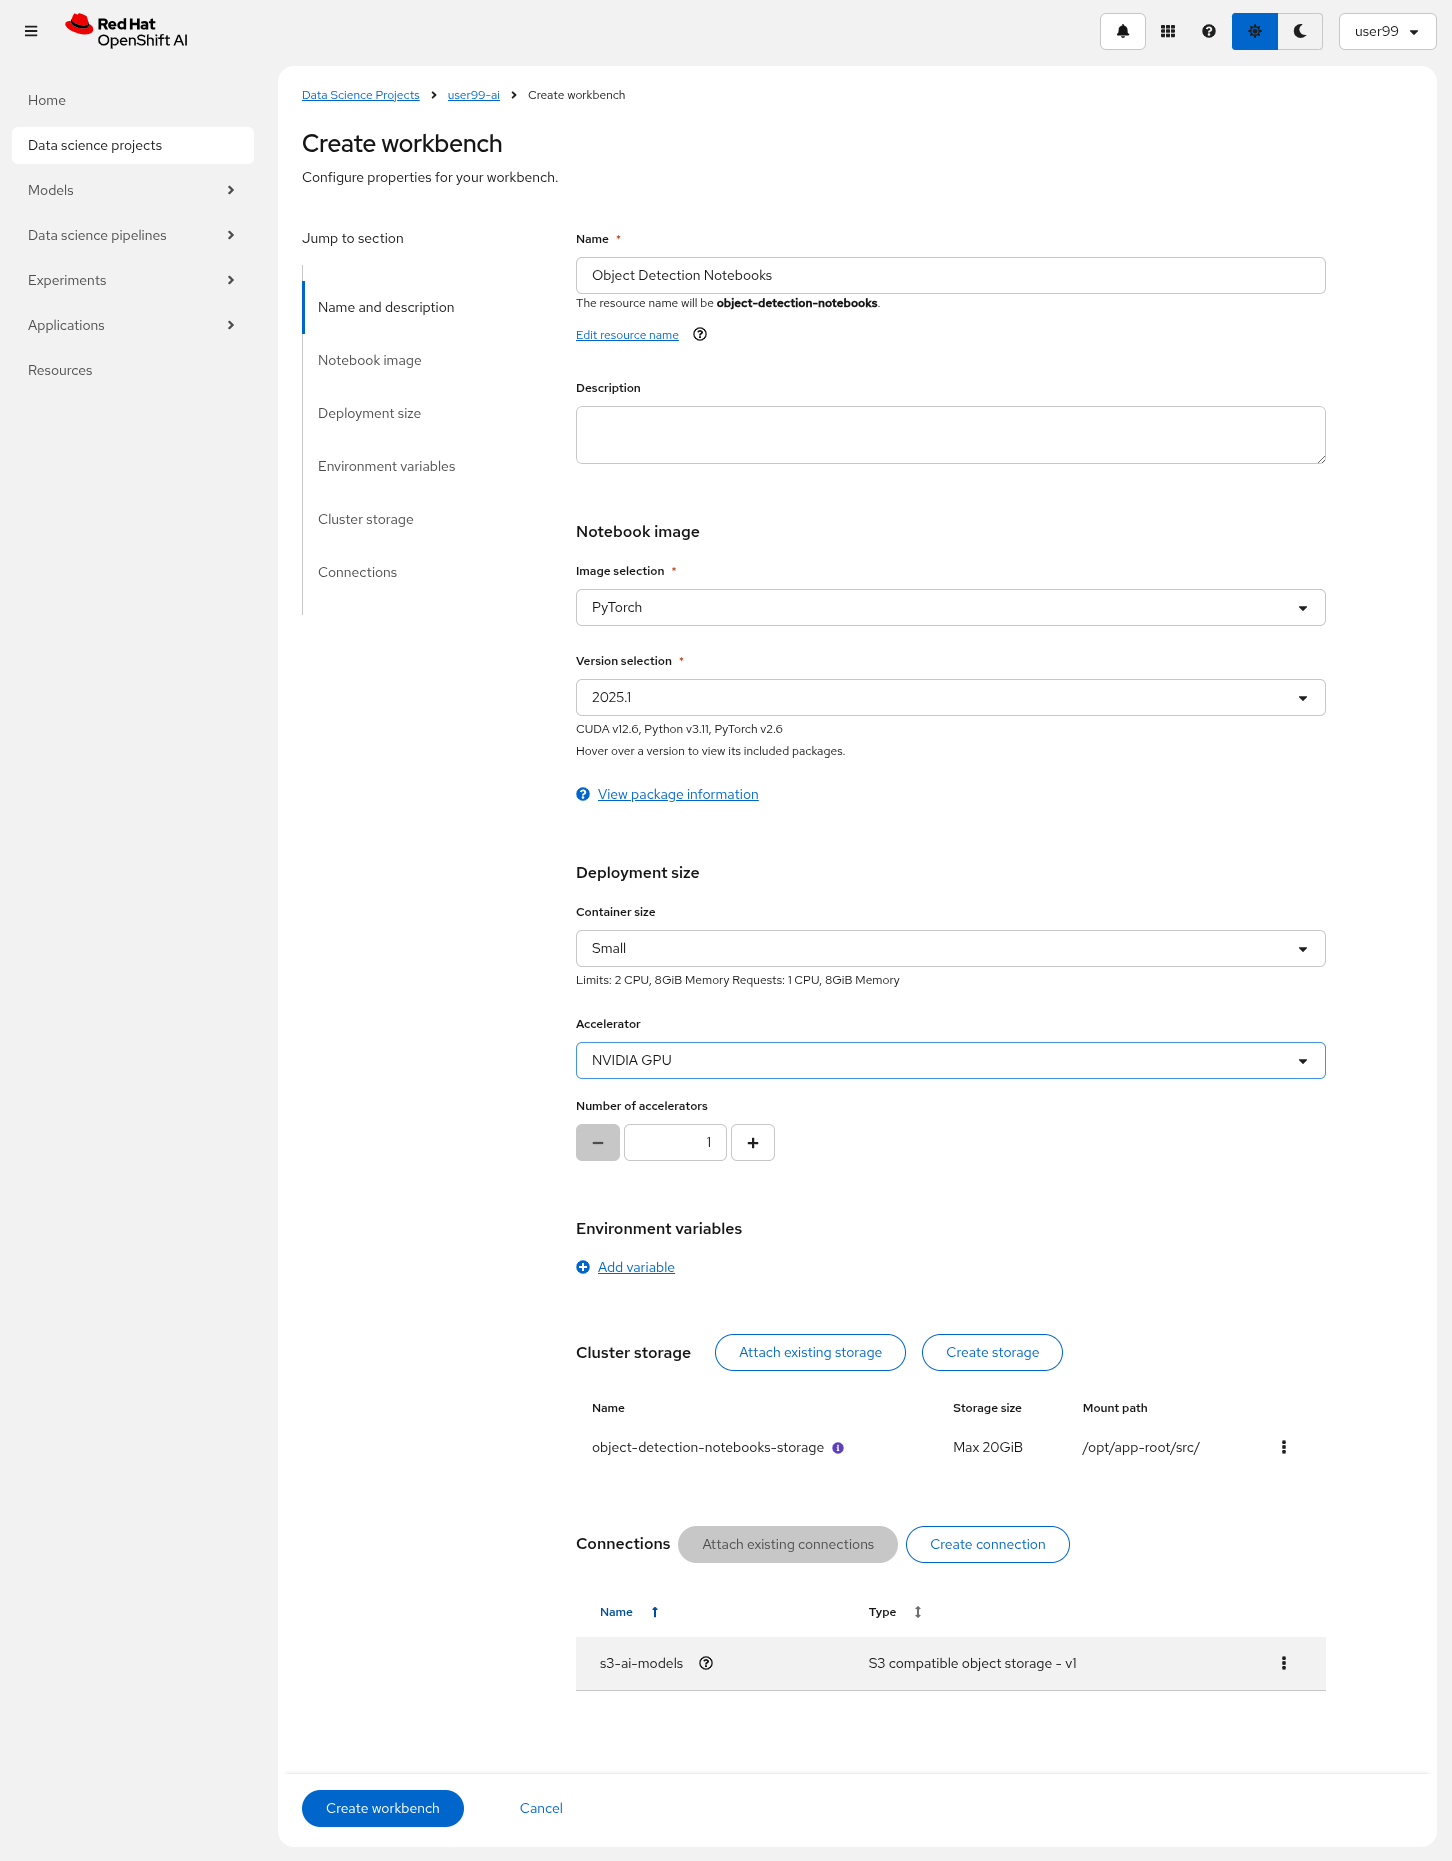
5- Create a new Workbench ("Workbenches" tab) named Object Detection Notebooks. You will need to select:
-
Base image that will be used to run your Jupyter Notebooks (select
PyTorch) -
Version selection (keep the default)
-
Container Size (
Smallis enough) -
Persistent Volume associated to the container (you can keep the default 20Gi Persistent Volume for your Notebook but you won’t need that much storage)
-
Attach the Object Storage Connection that you already configured.
-
Additionally, when you have GPUs you will find that during the Workbench creation you also can use accelerators (see an example below with NVIDIA GPUs).
6- Click "Create Workbench". It will take some time to create and start it.
7- Once started, open the Workbench (it could take time to open). You will be asked to allow permissions pior to show the Jupyter environment in your browser.
8- Clone the source the workshop’s Git repository: https://github.com/luisarizmendi/workshop-moving-ai-to-the-edge. Once you click "Clone" a message will appear in the button right. It could take some time to clone the repository.
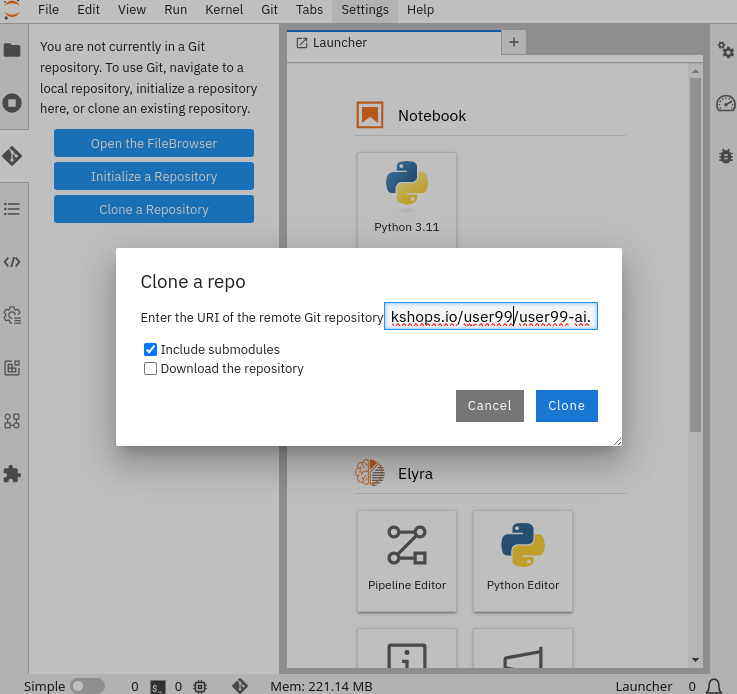
9- Move into the workshop-moving-ai-to-the-edge/resources/solutions/ai-specialist/development directory. Open the prototyping.ipynb
file
10- Paste the Roboflow access code in the first code block of the"Step 3: Download from Roboflow" and save your Notebook clicking the disk icon on the top bar menu.
Now you have your prototyping Jupyter Notebook ready. In order to start the prototype training you just need to click the "Run all blocks" (>> icon) icon on the top bar menu (click "Restart" button once it appears in the screen).
Even being a Mock Training it could take some time to finish if you are using CPUs instead of GPUs, in the meanwhile you can take a look at the cell’s output.
To facilitate easy verification of files uploaded to the object bucket, the workshop includes a (Web UI to browse the bucket contents. You can go to that console ( https://s3-browser-USERNAME-ai-models-USERNAME-tools.apps.$CLUSTER_DOMAIN ) and open the prototype/notebook folder. You will find a folder with the "model train name" and inside you will have the model with the best performance metrics (best.pt) and the last produced with the last training epoch (last.pt) along with the performance stats for the Test, Validation and Training sets.
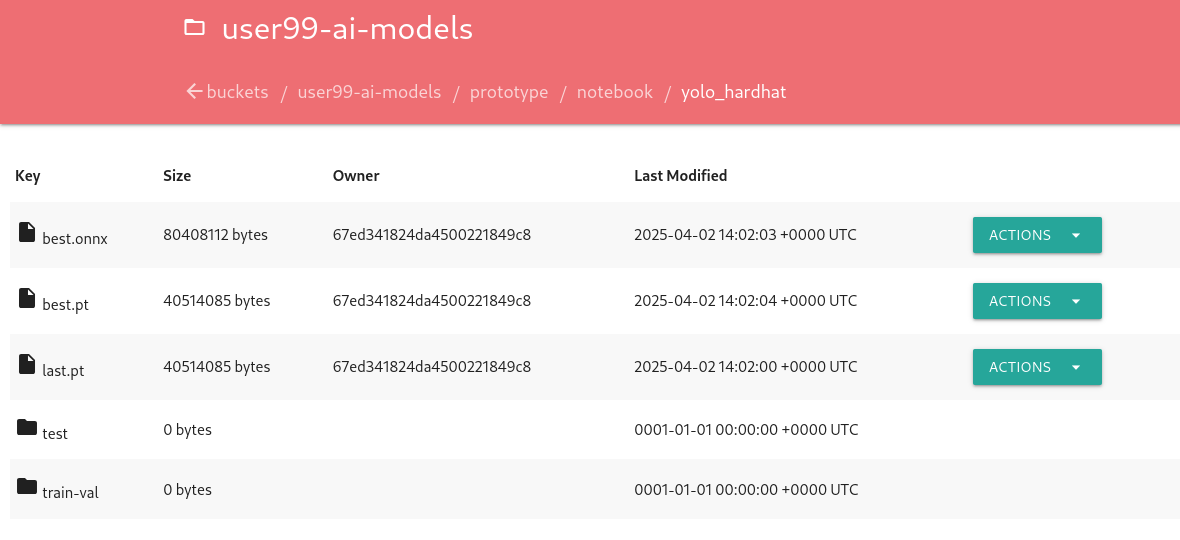
| Remember that you performed a Mock Training with a reduced number of epochs and few data, so you cannot use that model to detect hardhats. During the deployment phase you will use a provided pre-trained model. |
At this point you can navigate to "Data Science Projects" and stop your Workbench to save resources in the OpenShift cluster.
3. Model Training
| You have the full guide for this task in the Model Training section |
In production environments, training machine learning models is not as simple as running a script or experimenting in a notebook. A robust pipeline is essential. In this workshop we will use Kubeflow Pipelines.
In this step you will use the same tools than in the previous one: OpenShift AI and OpenShift Data Foundation.
Before Importing a pipeline you will need to enable the Pipeline server.
To create a Pipeline Server:
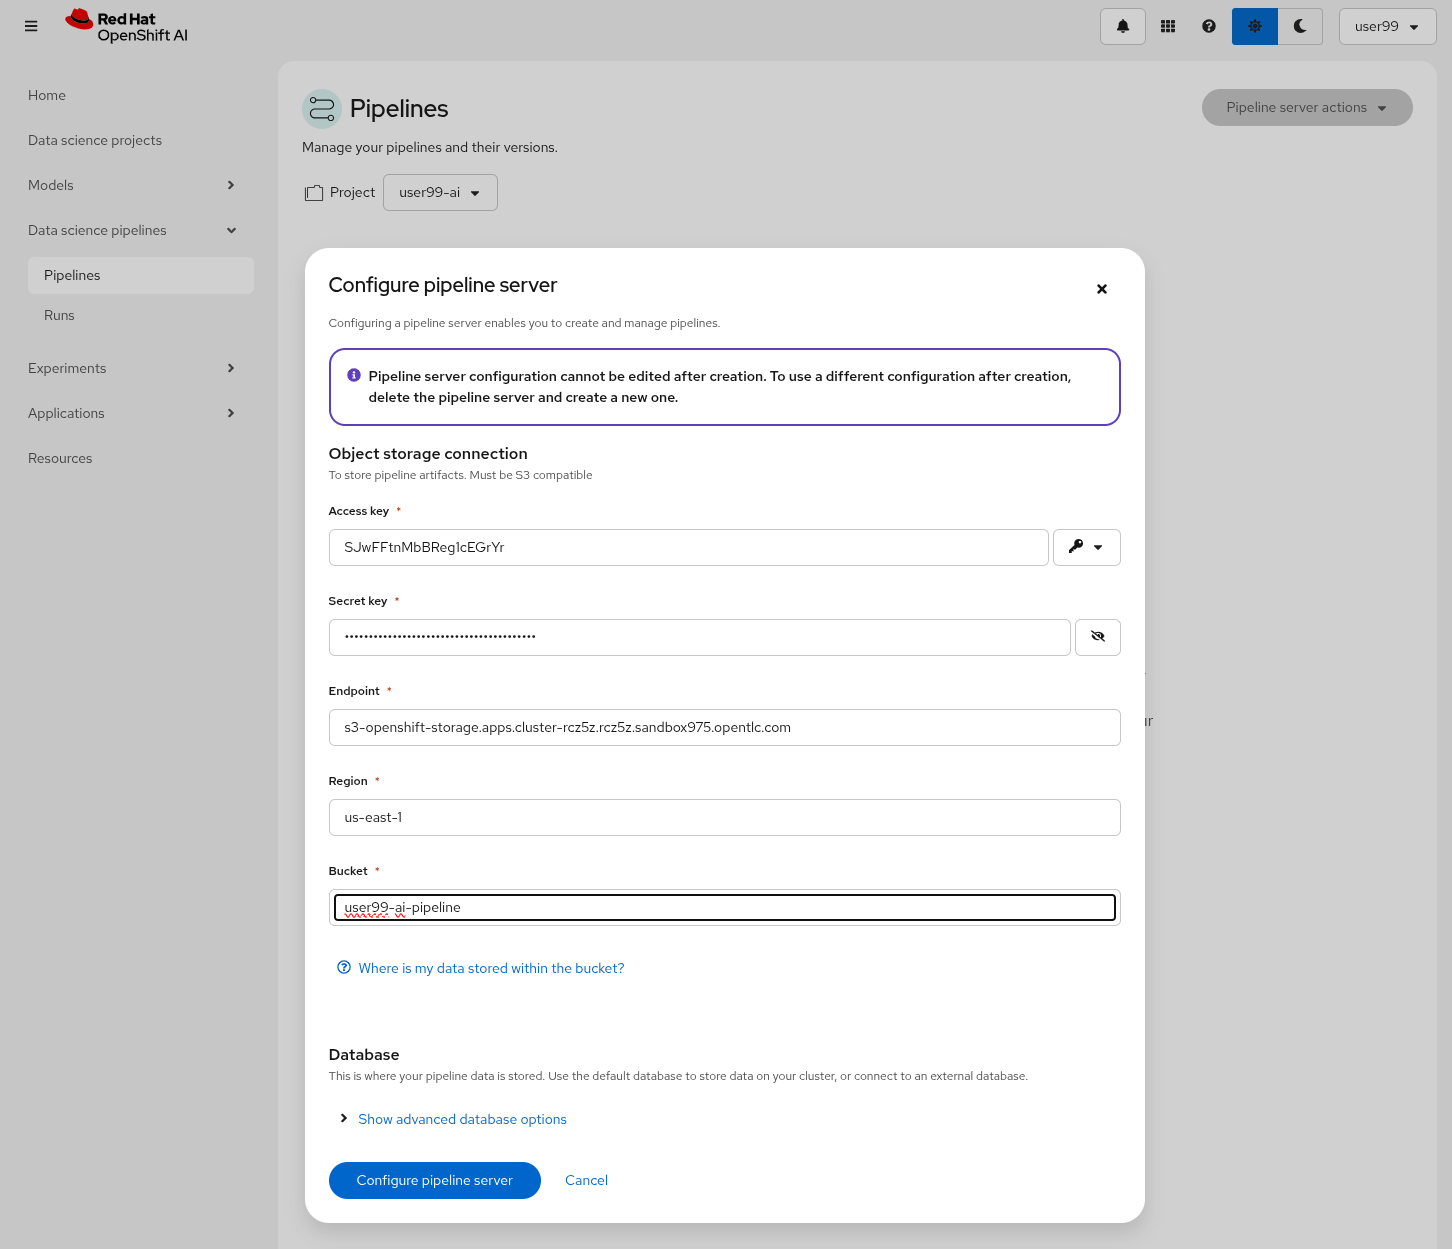
1- Navigate to "Data Science Pipelines > Pipelines" in OpenShift AI and configure a new pipeline server. Be sure that you are in the right project (USERNAME-ai)
2- Fill in the Data Connection information:
-
Access key:
OBJECT_STORAGE_PIPELINE_ACCESS_KEY -
Secret key:
OBJECT_STORAGE_PIPELINE_SECRET_KEY -
Endpoint:
s3-openshift-storage.apps.CLUSTER_DOMAIN -
Region: Keep the Region. If there is any pre-selected include any string (e.g.
local). -
Bucket:
USERNAME-ai-pipeline
3- Click "Configure pipeline server".
4- Once the configuration is ready, restart any running workbenches to apply the updates.
Wait until the Pipeline is ready. Then you can import your pipeline.
To proceed with the Kubeflow Pipeline import:
-
Go to "Data Science Pipelines > Pipelines"
-
Click Import Pipeline
-
Fill in Name (
hardhat-training) -
Select "Import by URL" and include the following URL:
|
If you don’t have GPUs or the GPUs are in use, you might want to import this other pipeline that does the training in the CPU: |
After the correct import, you will see the Pipeline diagram:
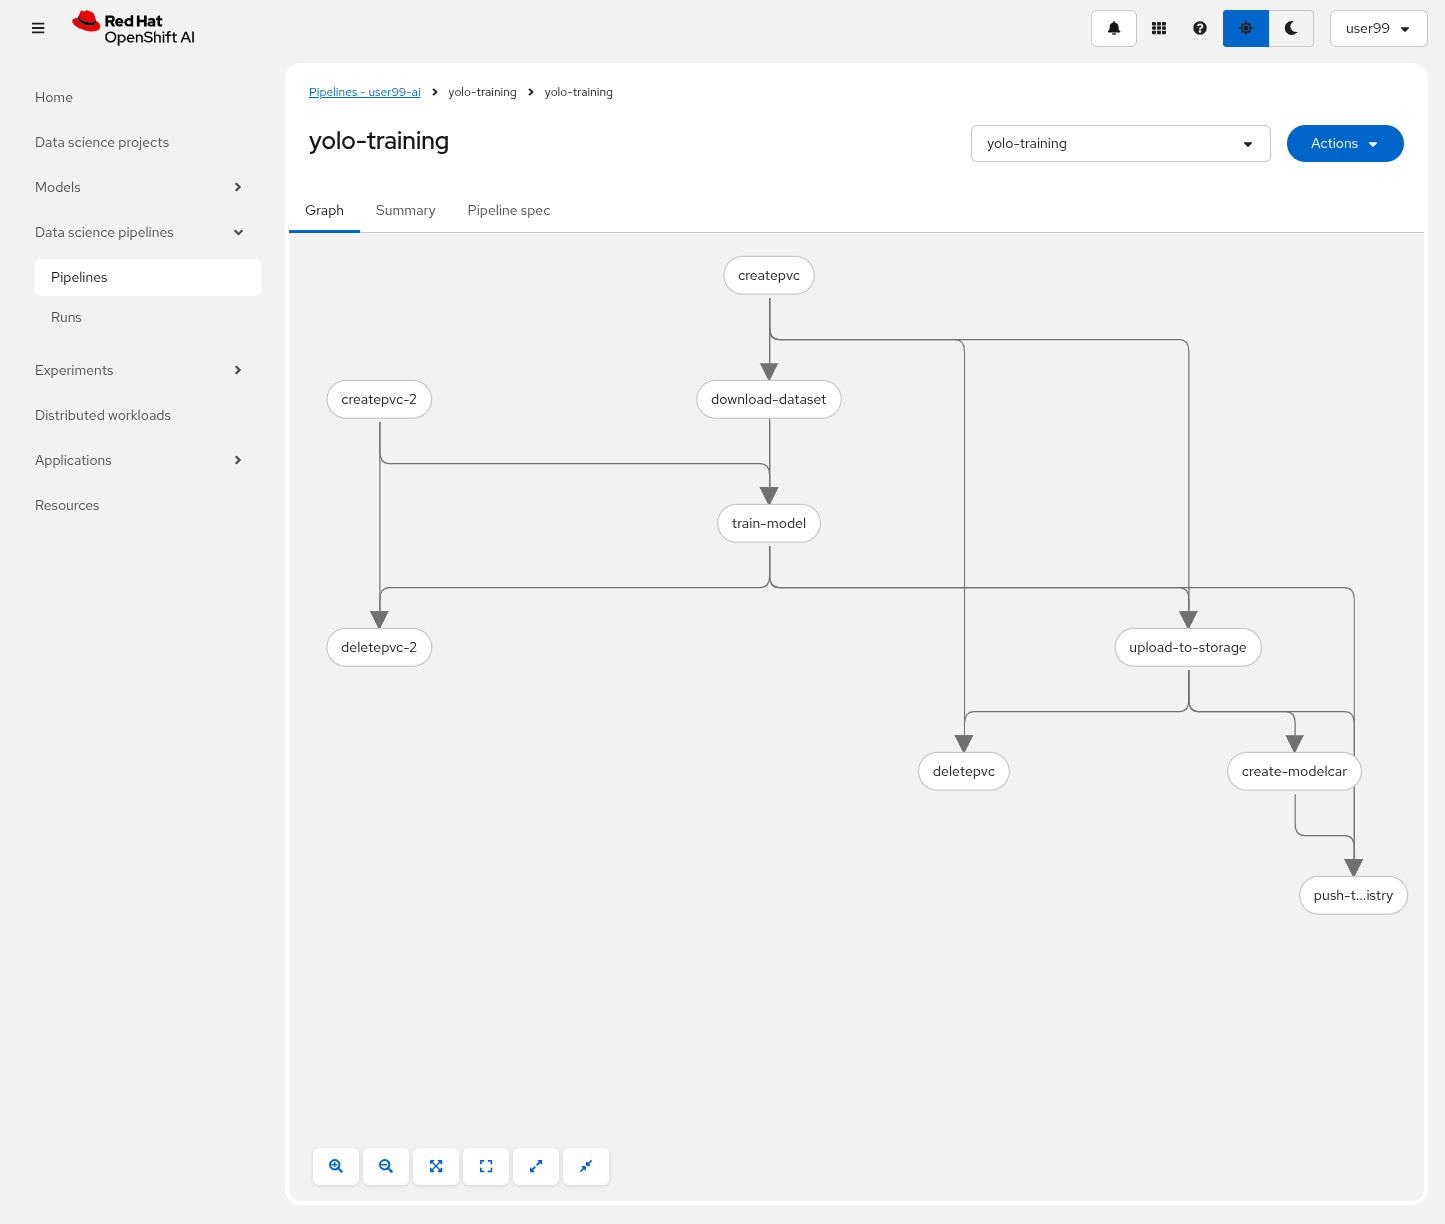
| You will find the Roboflow values in the code that you saved before, including Key, Project name, Workspace and Dataset version. |
It’s time to run the imported Kubeflow Pipeline:
-
Click Actions and then
Create run -
Under the "Project and experiment" section, you might want to click "Create new experiment" (and name it
hardhat-detection) -
Give the run a name (e.g.
v1) -
Fill in the parameters that are empty:
-
container_registry:
https://workshop-registry-quay-openshift-operators.apps.CLUSTER_DOMAIN -
object_access_key:
OBJECT_STORAGE_MODELS_ACCESS_KEY -
object_secret_key:
OBJECT_STORAGE_MODELS_SECRET_KEY -
object_storage_bucket:
USERNAME-ai-models -
roboflow_api_key:
<your value> -
roboflow_project:
<your value> -
roboflow_workspace:
<your value> -
roboflow_version:
<your value> -
workshop_username:
USERNAME
-
-
Adjust the "Batch Size" and the "Epochs". Since you will be running a Mock Training you can configure them to "1" to speed-up the pipeline execution.
-
Batch Size:
1 -
Ephoch number:
1
-
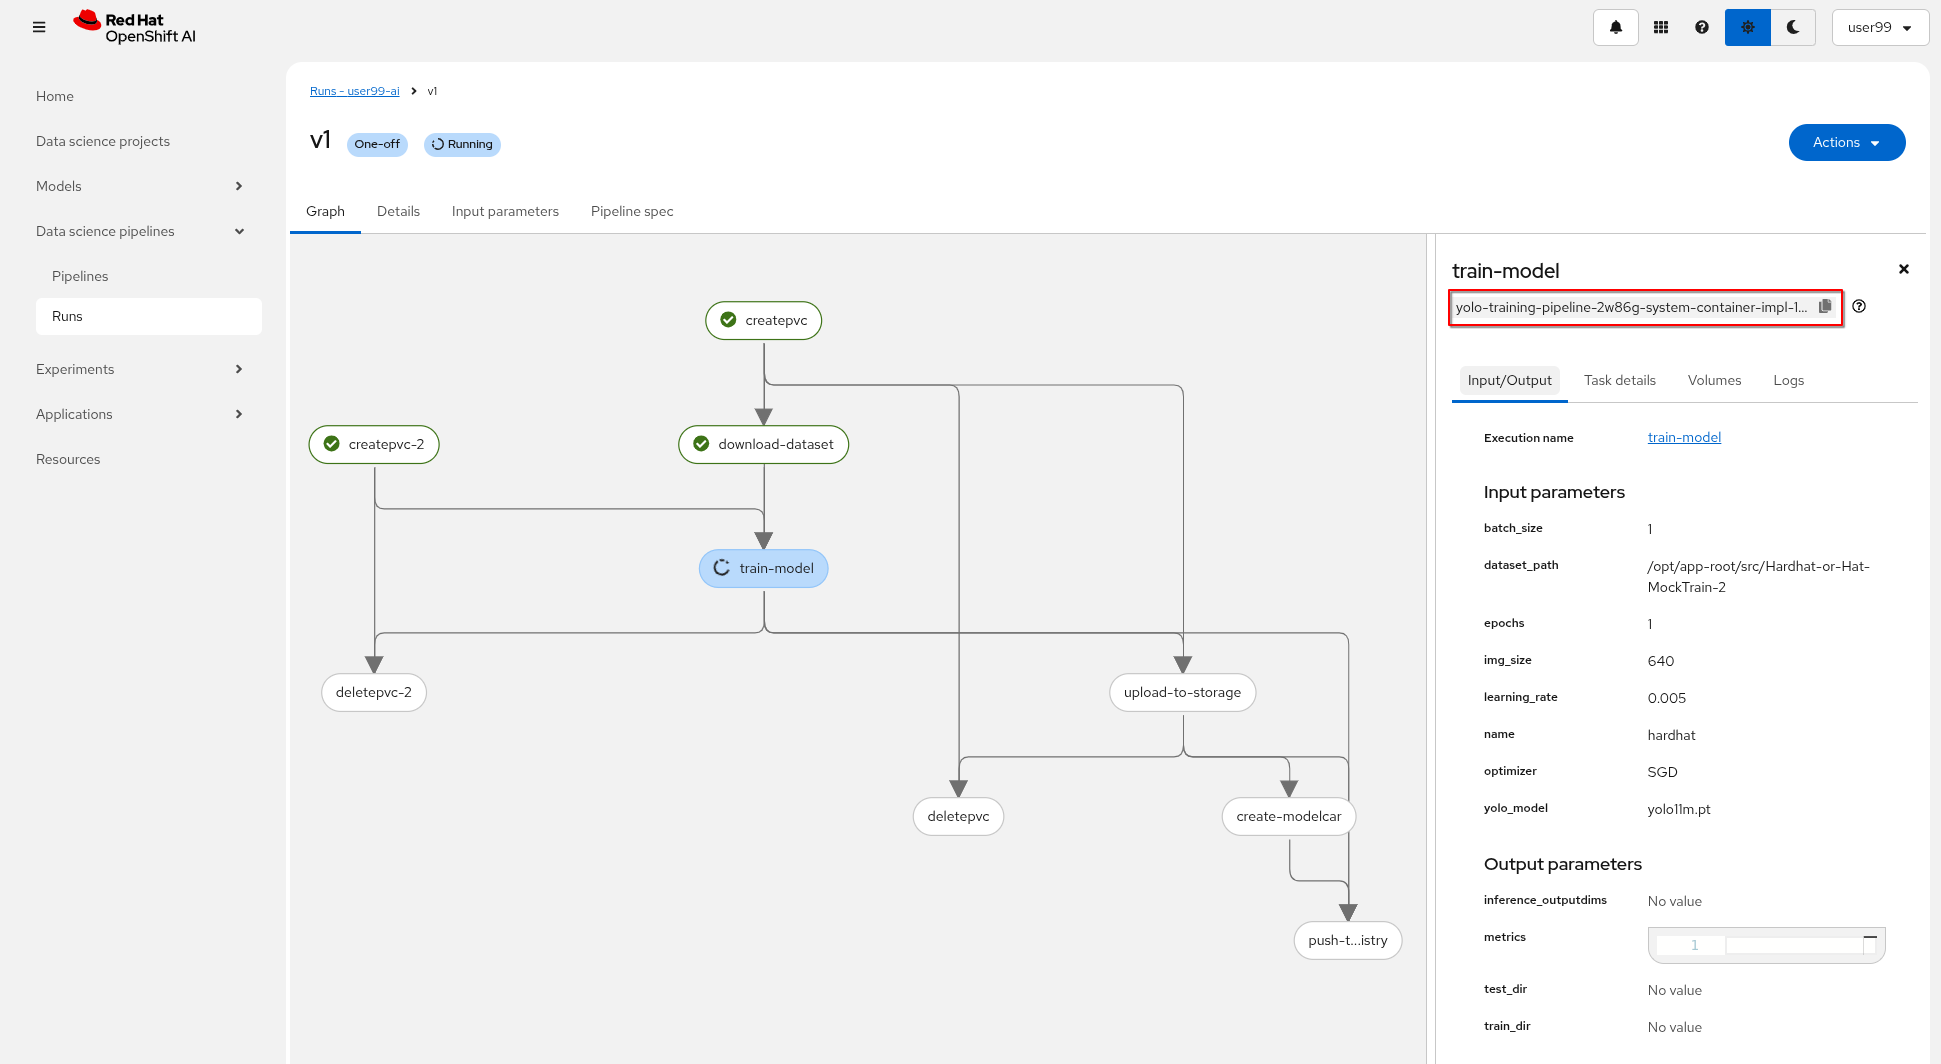
The first task (download-dataset) could take some time to finish if it’s the first run because it needs to pull the container image.
|
You can view the details of each task while it’s running to monitor important information. Additionally, you can check the POD name generated for the task (top right corner, in a red square in the image below), which is useful for accessing real-time logs in the OpenShift Console (since the Logs tab in the OpenShift AI Pipeline view is only available once the task has completed).
If the Pipeline run POD is scheduled in a node where other workloads using GPUs are located, it could happen that your GPU run out of memory. If it happens try reducing the batch size or launch the run again after the other workloads finished or just import the Kubeflow Pipeline that only make use of CPU (just for testing propouses).

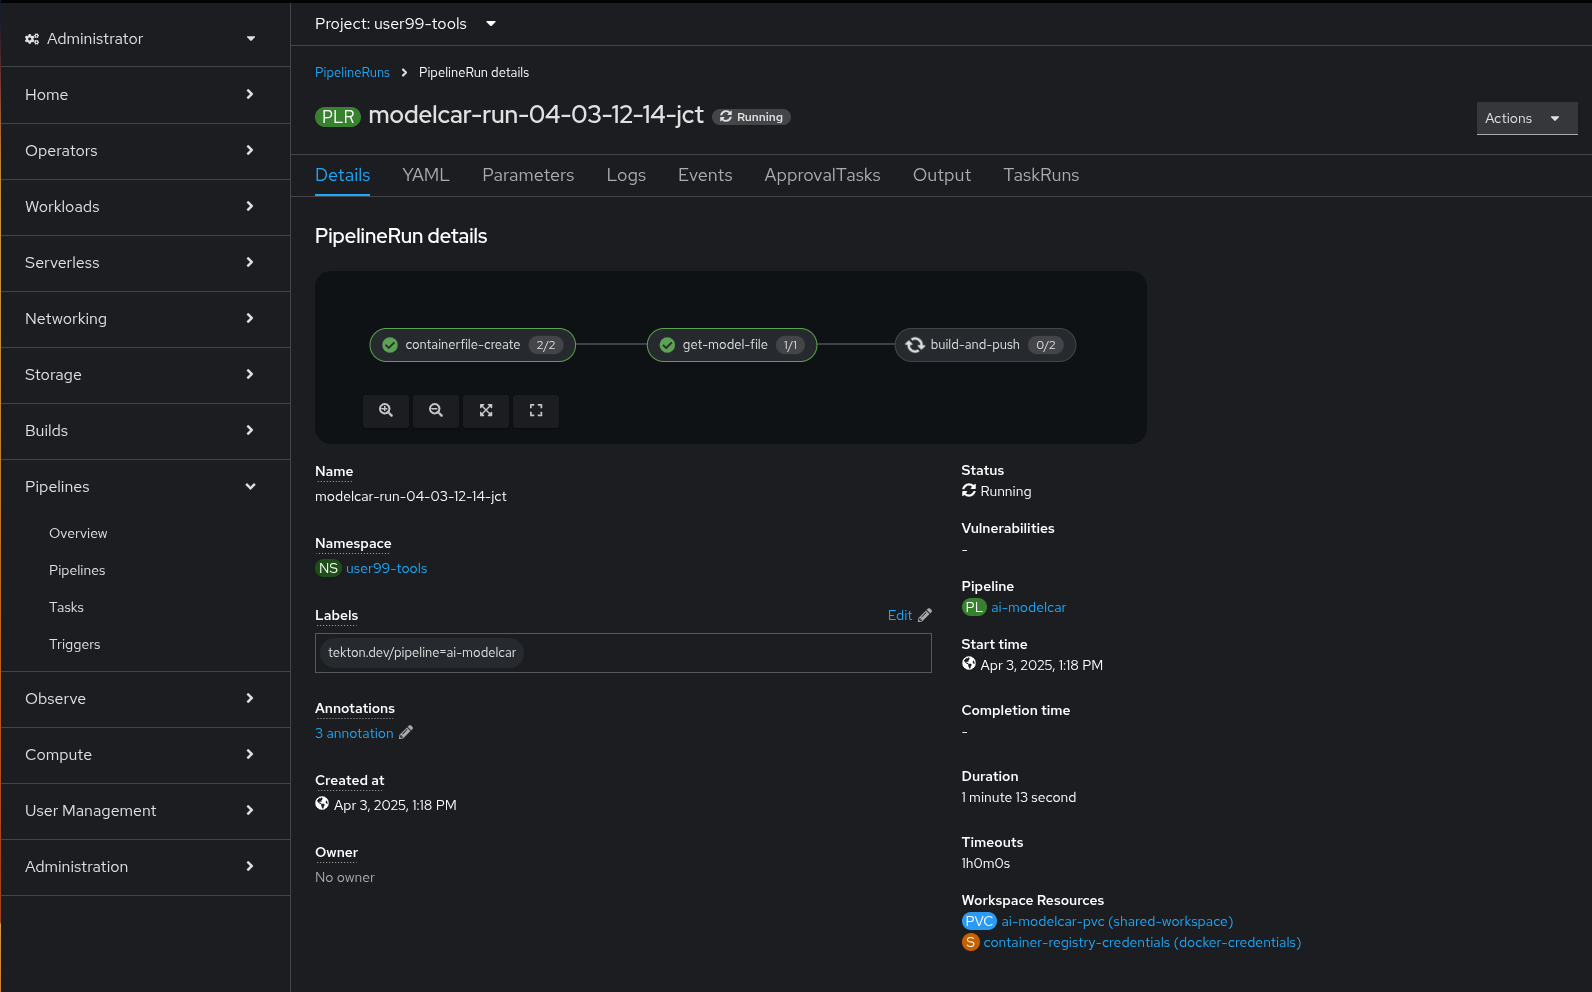
When the Kubeflow Pipeline reaches the create-modelcar you can navigate to the "Pipelines" menu in the OpenShift Console. There you can see the OpenShift Pipeline execution that creates the modelcar container image and push it into the Container Image Registry:
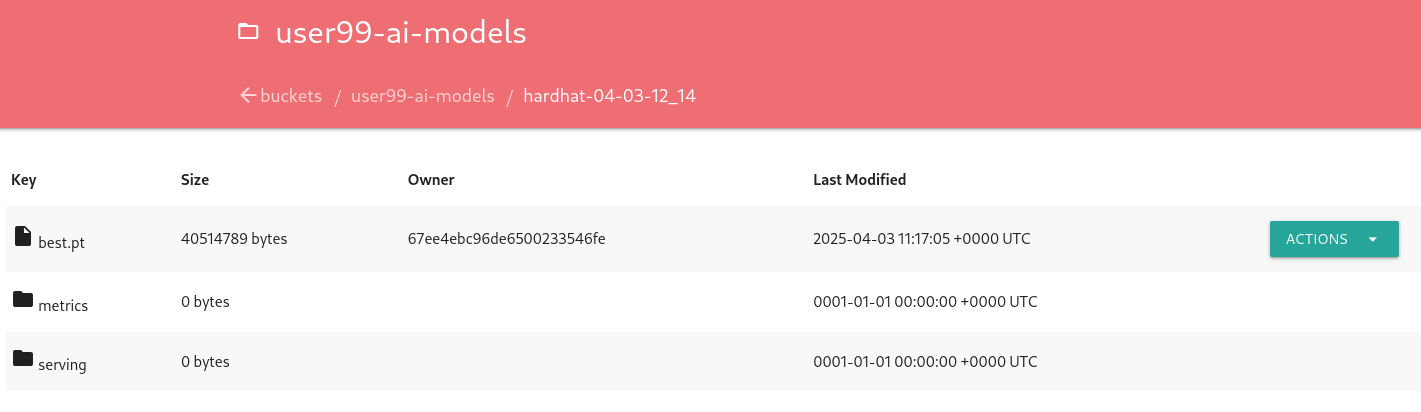
After some time, the pipeline will finish. You can at that point go to the Object Storage and check that:
1- The contents that have been uplaoded to models directory in your "USERNAME-ai-models" bucket.
2- The "modelcar" container image is available in the internal Quay Container Image Registry (user: USERNAME ; password: PASSWORD)
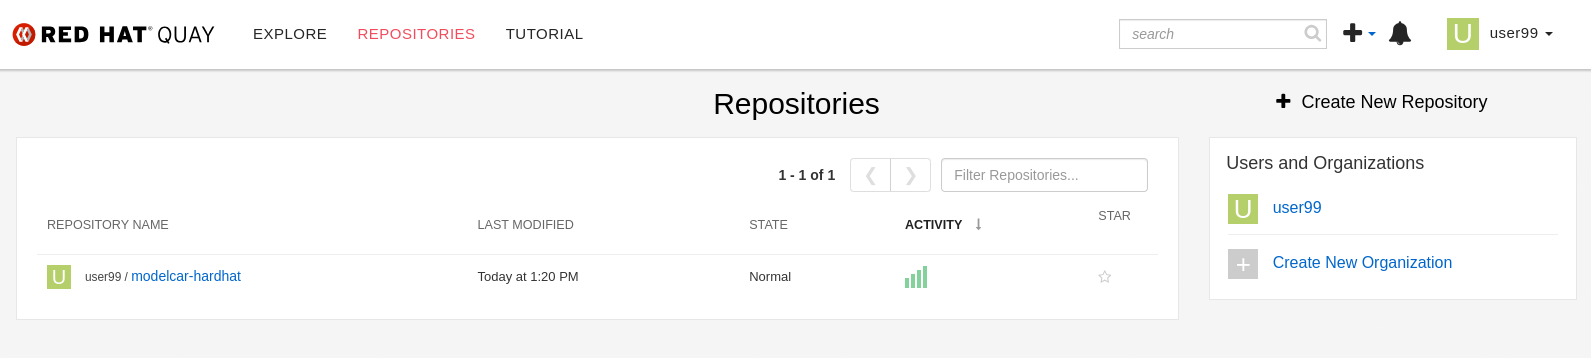
| The repository is created with "public" visibility, so you won’t need to include credentials when pulling it from the registry. This is designed to simplify the upcoming deployment steps in the workshop. However, in a production environment, it is strongly recommended to use proper credentials for security purposes. |
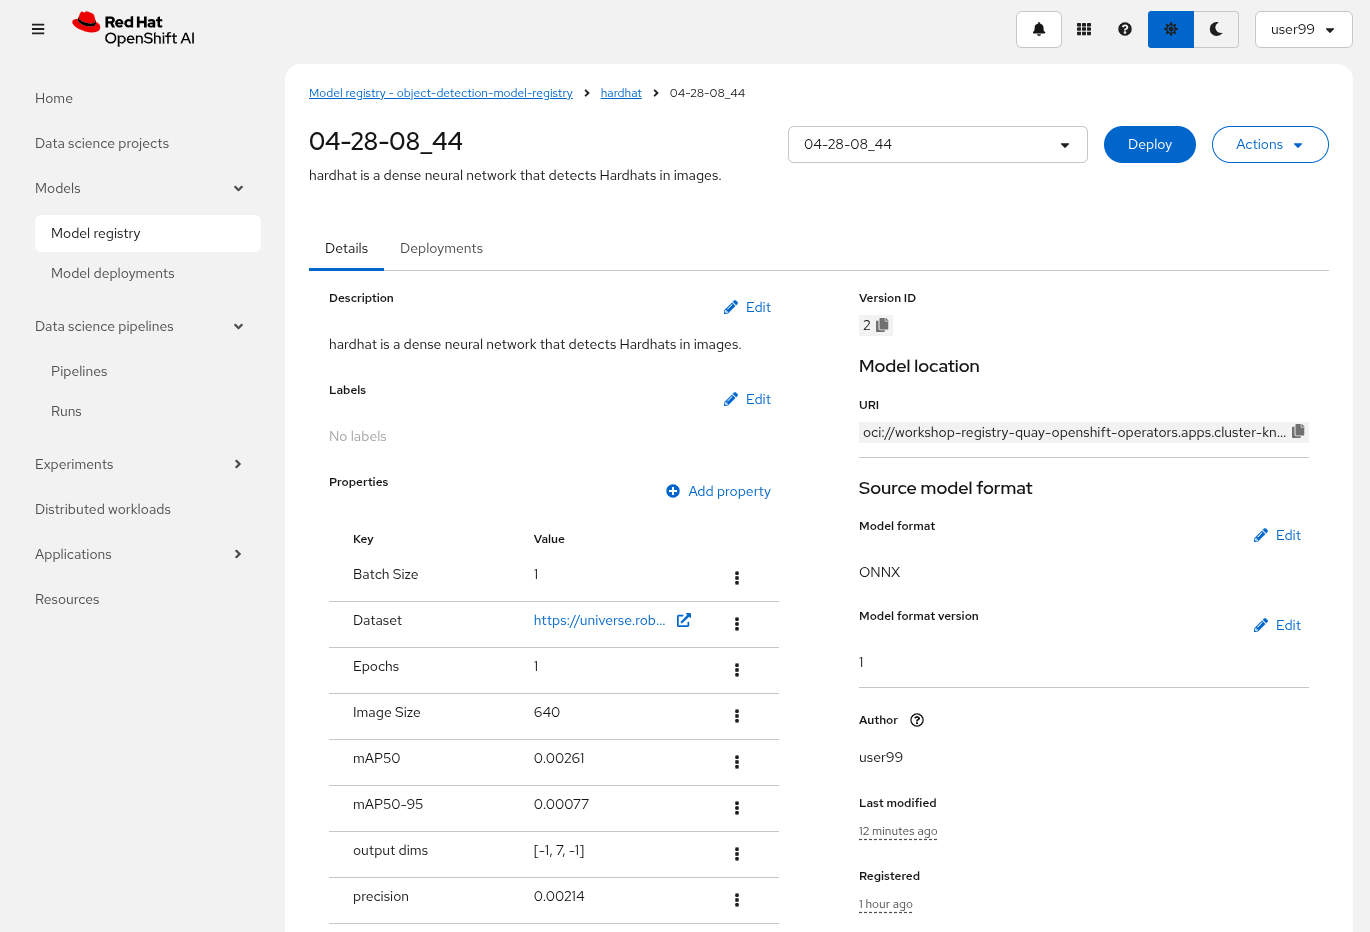
3- The newly trained model in the Model Registry (check the left menu in OpenShift AI console), where it will be available along with all the associated metadata details that were added during the registration process.
One thing to take into account now is that you used a reduced ("Mock Training") dataset and a limited number of epochs for faster training during this workshop, so the model produced won’t perform adequately in the field. It is advisable to discard that model. Instead, you can upload and use the provided pre-trained model going forward to ensure better accuracy and robustness in deployment.
If the model you use isn’t capable of delivering strong performance, you won’t achieve reliable or accurate results during the inference phase, so if you used the ("Mock Training") dataset you must update your modelcar image with the provided pre-trained model.
|
The easiest way to use the provided pre-trained model in your environment is to pull the v1 of this pre-created modelcar container image and push it into the Quay Container Image Registry.
podman pull https://quay.io/repository/luisarizmendi/modelcar-hardhat:v1

podman login -u {user} https://workshop-registry-quay-openshift-operators.apps.{ocp_cluster_url}/{user}

podman push https://workshop-registry-quay-openshift-operators.apps.{ocp_cluster_url}/{user}/<IMAGE NAME>:<IMAGE TAG>
4. Model Serving
| You have the full guide for this task in the Model Serving section |
The Model Serving Phase is where a validated machine learning model is prepared for production use.
OpenShift AI provides a Model Serving capability (based on (KServe and ModelMesh) to deploy the AI models inside the OpenShift cluster where OpenShift AI is installed.
We can use those to deploy our models in the same OpenShift cluster where the OpenShift AI platform is running but, as mentioned, these options could not be directly available for your edge use case, remember that for our use case the MLOps workflow diagram is:
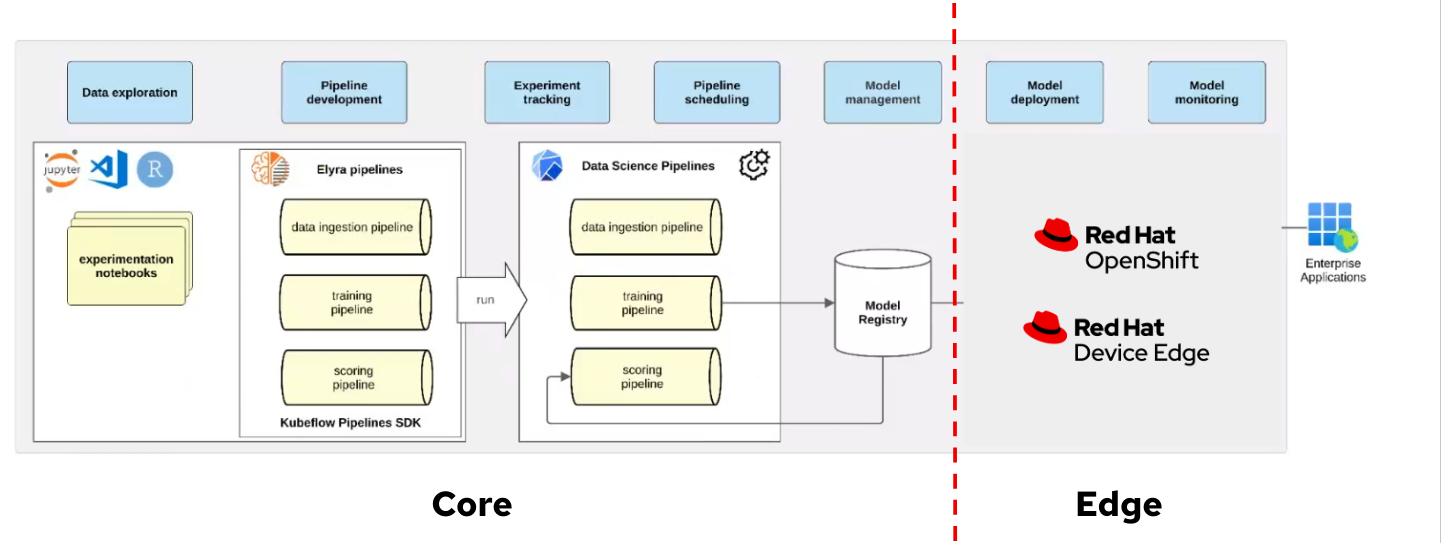
If you are using Microshfit or OpenShift at the Edge you can use the Kserve Custom Resource Definitions but if you plan to deploy your model directly on RHEL, without a Kubernetes API, you will need to use a different approach, for example running containers directly with Podman using Quadlets to configure them.
In this workshop we will be using an off-the-self inference server, Triton Server, more specifically the one provided by NVIDIA. Triton uses the KServe community standard inference protocols to define HTTP/REST and GRPC APIs plus several extensions so it is a good fit.
In this section, we will explore how to deploy our model and examine the inference performance. After that you will also deploy the associated microservices to do an end-to-end validation of the architecture used for the workshop use case. This architecture leverages the model’s predictions to create a system that raises alarms when individuals are not wearing hardhats. Lastly you will promote your model to be used in production.
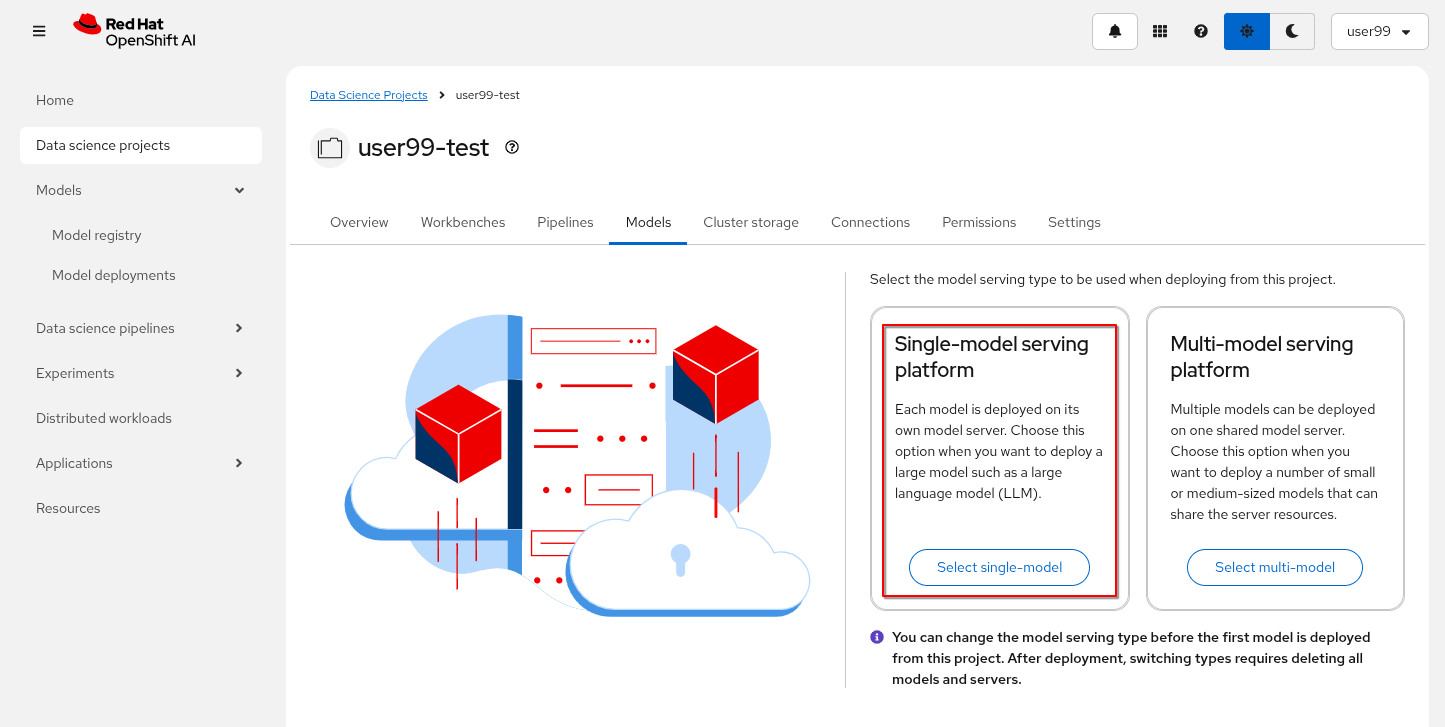
Let’s start by deploying the Triton Inference Server in OpenShift and check our model’s performance on it, but first you need enable the "Single-model serving" capability in one of your OpenShift Datascience Projects (USERNAME-test)
1- Go to OpenShift AI
2- Move to "Data Science Projects"
3- Go to the USERNAME-test
4- Click the "Models" tab
5- Select "single-model" platform
Now deploy the Inference Server with the model in onnx format provided by the modelcar container image that you produced during the training phase.
1- Go to OpenShift AI
2- Move to "Models > Model Registry" and select your model
3- Click on the version that you want to test
4- Select "Deploy" on the top right corner
5- Select the project USERNAME-test and fill-in the form:
-
Model name:
hardhat-test(we use that name in a Job below) -
Serving runtime:
NVIDIA Triton Server v25.03 (gRPC) -
Framework:
onnx - 1.20.1 -
Deployment mode:
Standard -
Number of replicas:
1 -
Model server size:
Small -
Accelerator: If you have GPUs available choose your accelerator.
-
Make deployed models available through an external route:
not selected -
Require token authentication:
not selected -
Create a new connection:
-
Connection type:
OCI compliant registry -v1 -
Conection name: I suggest something like
<modelcar-name>-<tag> -
Access type: Push + Pull
-
Secret details:
CONTAINER_REGISTRY_DOCKERCONFIGJSON -
Registry host:
workshop-registry-quay-openshift-operators.apps.CLUSTER_DOMAIN -
OCI storage location: Keep the auto-completed URL
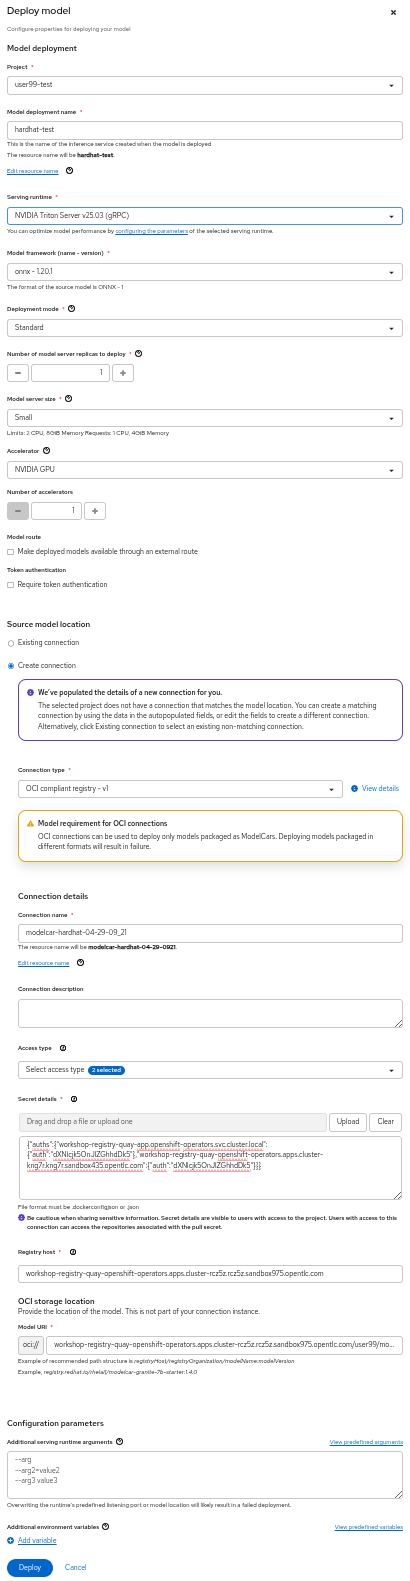
6- Click "Deploy"
| The Inference Server may take some time to become available upon initial deployment but you should see it deploying. If you don’t see any deployed model go to "Models > Model deployments" and be sure that you are in the right Project (USERNAME-test). |
When the Inference server appears as avialable in the OpenShift AI console, you will be able to copy the internal endpoint that we need to use to access to it (copy the endpoint).
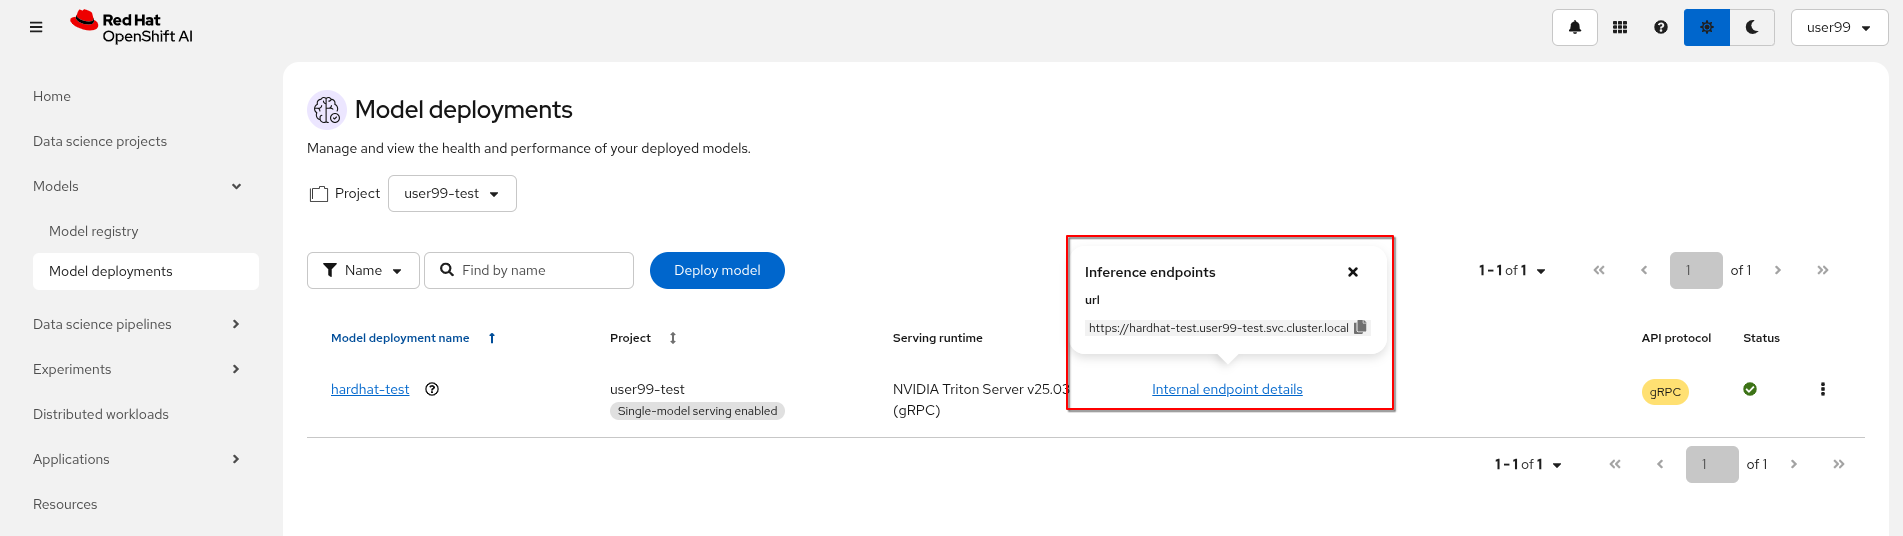
Now that the Inference Server is running and you have the endpoint needed to access it, let’s deploy a test application that uses the server to tag a set of images.
1- Go to the "Administrator" view in the OpenShift Console
2- Click on the + button on the top right corner of the UI to deploy a new YAML file
3- Be sure that you are in the right project (USERNAME-test) and paste the following YAML
apiVersion: apps/v1
kind: Deployment
metadata:
  name: object-detection-batch-kserve-api
  labels:
    app: object-detection-batch-kserve-api
spec:
  replicas: 1
  selector:
    matchLabels:
      app: object-detection-batch-kserve-api
  template:
    metadata:
      labels:
        app: object-detection-batch-kserve-api
    spec:
      containers:
      - name: batch-model-api
        image: quay.io/luisarizmendi/object-detection-batch-kserve-api:grpc
        ports:
        - containerPort: 8800
        env:
          - name: TRITON_SERVER_URL
            value: '<CHANGE ME TO INFERENCE INTERNAL ENDPOINT>:8001'
          - name: MODEL_NAME
            value: 'hardhat'
---
apiVersion: v1
kind: Service
metadata:
  name: object-detection-batch-kserve-api
  labels:
    app: object-detection-batch-kserve-api
spec:
  selector:
    app: object-detection-batch-kserve-api
  ports:
  - protocol: TCP
    port: 8800
    targetPort: 8800
  type: ClusterIP
---
apiVersion: route.openshift.io/v1
kind: Route
metadata:
  name: object-detection-batch-kserve-api
  labels:
    app: object-detection-batch-kserve-api
spec:
  to:
    kind: Service
    name: object-detection-batch-kserve-api
  port:
    targetPort: 8800
  tls:
    insecureEdgeTerminationPolicy: Redirect
    termination: edge
4- Change the <CHANGE ME TO INFERENCE INTERNAL ENDPOINT> string with the internal endpoint value that you copied from the deployed Inference Server
If you used the values proposed in the workshop the MODEL_NAME environment variable will be hardhat so you can keep the default
|
5- Click "Create"
6- Wait until the POD is in "Running" status and then move to "Networking > Routes"
7- Open the application’s URL
You’ll see a UI with the endpoint of your Inference Server pre-selected. You can now upload images of people wearing or not wearing hard hats to the application (for example, images from the "Test" set of your dataset), then click "Submit".
Make sure the uploaded images do not show 0 KB in size. Chrome does not support drag-and-drop in all contexts, and depending on where the files are stored on your computer, they may fail to upload.
|
The inference process may take some time depending on the number of images and whether you’re using a GPU. Once it completes, you should see a result similar to the following:
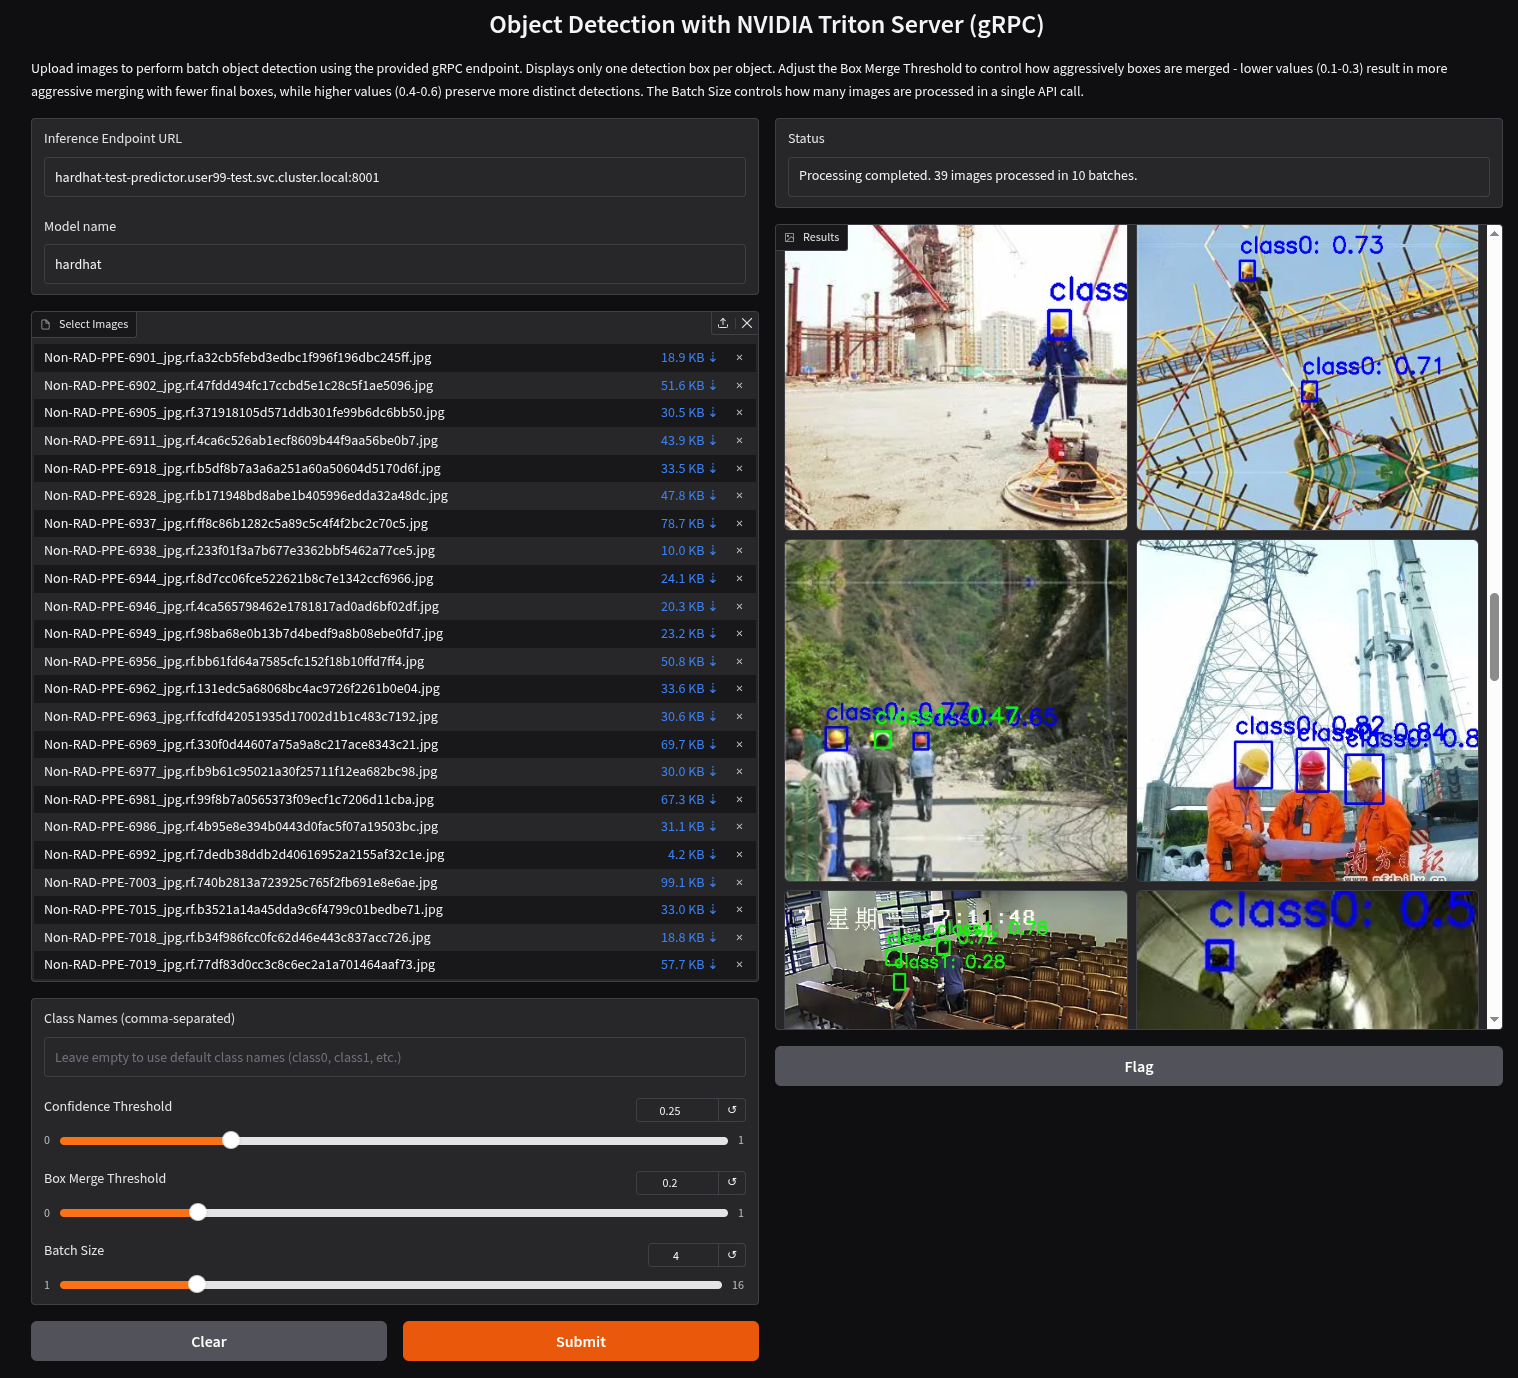
As you can see, hardhats were detected on the images, so we are good to perform an end-to-end validations of the model using the microservices used in production, but first understand the overall solution architecture, including the microservices involved and how they communicate. In this architecture we use a webcam to detect objects at the edge, and how those detections can trigger messages/alarms that can be visualized in a dashboard on the Core Datacenter/Cloud.
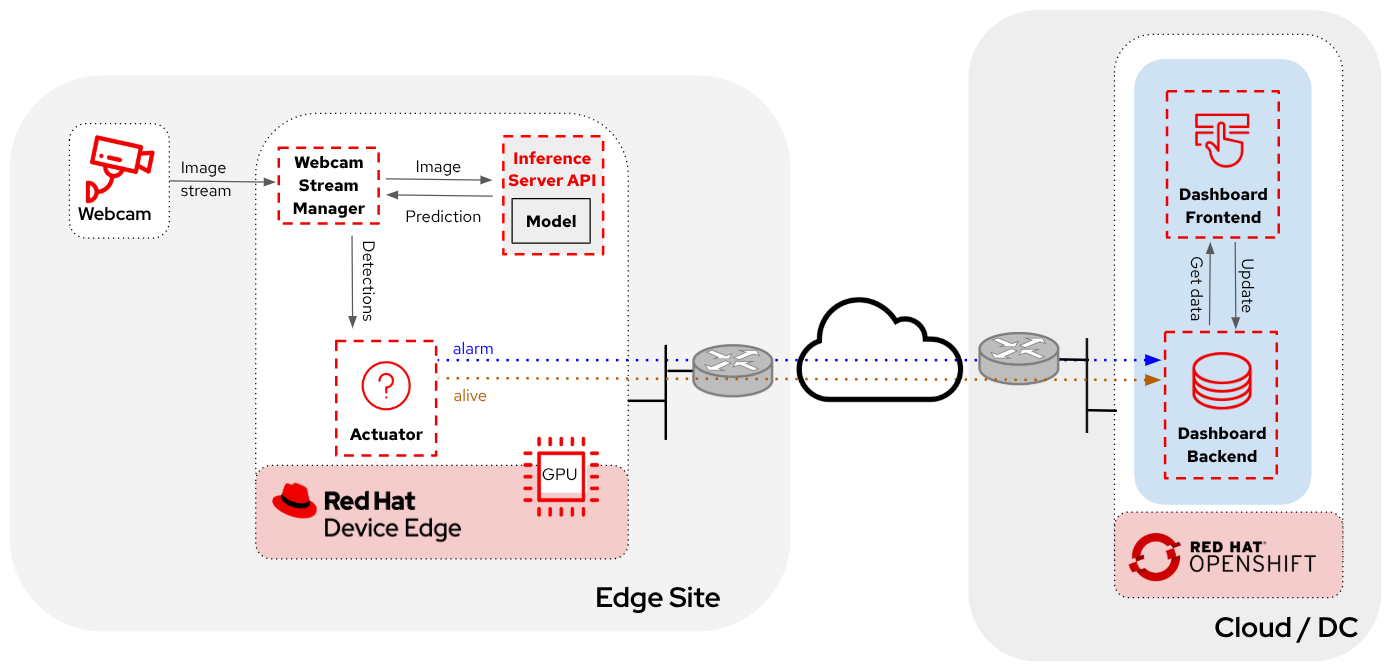
The solution is based on the following microservices, you can clik on the names to get detailed information about each one:
-
Inference server
The workflow is the following:
-
The Camera Stream Manager sends images to the Inference API
-
The Inference Server, that contains the AI model detecting objects, returns the predictions
-
The "Action" service calls the inference endpoint and if detects certain objects it will trigger an alarm, that is sent to the database hosted in a remote site.
-
The information of the device is shown in the Dashboard
As you can see, there are both edge (local-side) and cloud or data center (cloud-side) environments. Let’s start by deploying the cloud-side applications in OpenShift.
Follow the steps below to create the Dashboard backend and Dashboard frontend applications in OpenShift:
1- Navegate to the "Administrator" view in the OpenShift Console
2- Log in using your OpenShift credentials: USERNAME / PASSWORD.
3- Be sure that you are in the (USERNAME-test) project
4- Click on the + icon on the top right corner of the OpenShift console to deploy a new YAML file.
5- Double-check that you are in the USERNAME-test project and paste there the content shown below to deploy the Dashboard, then click "Create".
apiVersion: batch/v1
kind: Job
metadata:
  generateName: dashboard-deploy-
spec:
  selector: {}
  template:
    metadata:
      name: dashboard-deploy
    spec:
      containers:
        - name: shell
          image: quay.io/luisarizmendi/ocp-job:latest
          command: ["/bin/sh", "-c"]
          args:
          - |
            NAMESPACE=$(< /var/run/secrets/kubernetes.io/serviceaccount/namespace)
            echo "Using namespace $NAMESPACE"

            echo "Creating Dashboard Backend"

            oc apply -f - <<EOF
            apiVersion: apps/v1
            kind: Deployment
            metadata:
              name: object-detection-dashboard-backend
              labels:
                app: object-detection-dashboard
                app.kubernetes.io/part-of: Dashboard
                app.openshift.io/runtime: "python"
            spec:
              replicas: 1
              selector:
                matchLabels:
                  app: object-detection-dashboard
                  component: backend
              template:
                metadata:
                  labels:
                    app: object-detection-dashboard
                    component: backend
                spec:
                  containers:
                  - name: backend
                    image: quay.io/luisarizmendi/object-detection-dashboard-backend:v1
                    ports:
                    - containerPort: 5005
            ---
            apiVersion: v1
            kind: Service
            metadata:
              name: object-detection-dashboard-backend
              labels:
                app: object-detection-dashboard
            spec:
              selector:
                app: object-detection-dashboard
                component: backend
              ports:
              - protocol: TCP
                port: 5005
                targetPort: 5005
              type: ClusterIP
            ---
            apiVersion: route.openshift.io/v1
            kind: Route
            metadata:
              name: object-detection-dashboard-backend
              labels:
                app: object-detection-dashboard
            spec:
              to:
                kind: Service
                name: object-detection-dashboard-backend
              port:
                targetPort: 5005
            EOF

            while true; do
              HOST=$(oc get route object-detection-dashboard-backend -n $NAMESPACE -o jsonpath='{.status.ingress[0].host}')
              if [[ -n "$HOST" ]]; then
                BACKEND_API_BASE_URL="http://$HOST"
                break
              fi
              sleep 2
            done
            echo "BACKEND API URL: $BACKEND_API_BASE_URL"

            echo "Creating Dashboard Frontend"

            oc apply -f - <<EOF
            apiVersion: apps/v1
            kind: Deployment
            metadata:
              name: object-detection-dashboard-frontend
              labels:
                app: object-detection-dashboard
                app.kubernetes.io/part-of: Dashboard
                app.openshift.io/runtime: "nodejs"
              annotations:
                app.openshift.io/connects-to: '[{"apiVersion":"apps/v1","kind":"Deployment","name":"object-detection-dashboard-backend"}]'
            spec:
              replicas: 1
              selector:
                matchLabels:
                  app: object-detection-dashboard
                  component: frontend
              template:
                metadata:
                  labels:
                    app: object-detection-dashboard
                    component: frontend
                spec:
                  containers:
                  - name: frontend
                    image: quay.io/luisarizmendi/object-detection-dashboard-frontend:v1
                    ports:
                    - containerPort: 3000
                    env:
                    - name: BACKEND_API_BASE_URL
                      value: $BACKEND_API_BASE_URL
            ---
            apiVersion: v1
            kind: Service
            metadata:
              name: object-detection-dashboard-frontend
              labels:
                app: object-detection-dashboard
            spec:
              selector:
                app: object-detection-dashboard
                component: frontend
              ports:
              - protocol: TCP
                port: 3000
                targetPort: 3000
              type: ClusterIP
            ---
            apiVersion: route.openshift.io/v1
            kind: Route
            metadata:
              name: object-detection-dashboard-frontend
              labels:
                app: object-detection-dashboard
            spec:
              to:
                kind: Service
                name: object-detection-dashboard-frontend
              port:
                targetPort: 3000
            EOF

      restartPolicy: Never
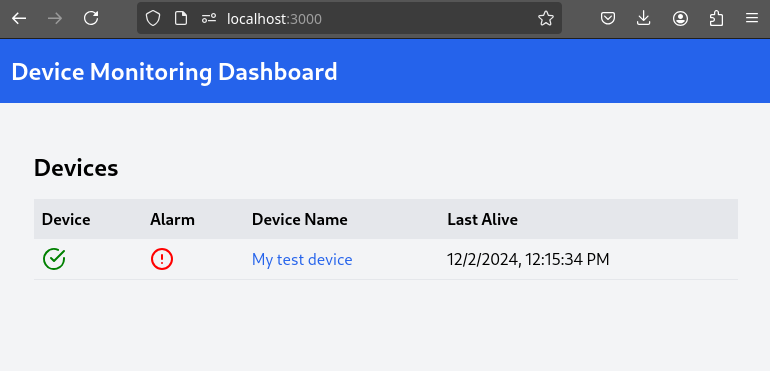
6- When all pods are running, you can http://object-detection-dashboard-frontend-USERNAME-test.apps.CLUSTER_DOMAIN [open the Dashboard using the Frontend URL]. You will see an empty page with the "Device Monitoring Dashboard" title.
The Dashboard application does not use TLS, so the URL must start http:// and https:// otherwhile you will get a message "Application is not available" even when then POD is already running.
|
You’ve successfully deployed the cloud-side applications! Now, take the next step by running the remaining applications on your own laptop. In this case you have to deploy the following services:
-
Inference server
-
Camera stream manager
-
Actuator
| Instructions below are for Fedora/RHEL based systems and using the interactive mode, so you can review live logs easily (you will need to use three different command line terminals). |
Be sure that you have the ports tcp/8080, tcp/8000, tcp/8001 and tcp/5000 ports open un your local machine.
|
Inferencing with a CPU can be slow. However, if you have an NVIDIA GPU in your laptop, you can deploy the Inference Server using it for testing. Let’s proceed with the deployment.
If you want to use NVIDA GPUs in your system, be sure that you have it configured in your system and that you run sudo nvidia-ctk cdi generate --output=/etc/cdi/nvidia.yaml before running the inference container.
|
1- Choose the right Inference Server deployment script depending if you are using GPU or not
2- Download the script and give it execution permission
3- Run the script
<your-script-name> create quay.io/luisarizmendi/modelcar-hardhat:v1
| Since you performed a "Mock Training" you will be using the pre-generated modelcar Container image instead the one that you created. |
These are large images, the pull could take time, be sure that the inference server pod is running using podman ps
|
The script creates a Podman POD with an init-container (it runs before the "main" container starts) that pull the modelcar container, extract the model files and share them with the Inference Server. That’s the same approach that when you are using the modelcar in OpenShift.
The Inference service will be available at http://localhost:8001 (gRPC) and http://localhost:8000 (REST). You can check that the model has been loaded with the right values:
curl http://localhost:8000/v2/models/hardhatLet’s move on and deploy the Camera stream manager.
This is the service that will take images from your Webcam and send them to the Inference Server. It will also publish the detections in an endpoint.
In this case you will need to run it as privileged to access the system devices (webcams) and also to use the host network (to simplify inter-container communication), so it can reach out to the inference server.
sudo podman run -it --rm -p 5000:5000 --privileged --net host -e TRITON_SERVER_URL=localhost:8001 -e MODEL_NAME=hardhat -e CLASS_NAMES=helmet,no_helmet quay.io/luisarizmendi/object-detection-stream-manager:grpc| Remember to run it with privileges so it can access the video devices. |
You can add --gpus all if you have a GPU in your laptop and you want to use it for pre and post image processing.
|
You will see logs directly in the console terminal. The Inference Server may already be displaying detection results, and if a no_helmet detection occurs, the "Actuator" will trigger an alarm. Additionally, the Camera Stream Manager logs important details at startup, such as the selected webcam ID, providing useful insights for debugging and verification
| We are deploying the service version that uses gRPC to send data to the inference service because it introduces less overhead. If you want to review and use the REST version to compare it with the gRPC you can check the script README file. |
This won’t work for MAC users since camera access from containers is different in that OS. If you are a MAC user you can still run this service by downloading and running directly the object-detection-stream-manager.py python script on your system with python object-detection-stream-manager.py. Remember to install the python dependencies with pip install and to grant permissions to access cameras if needed.
|
|
During the container launch, you specify the class names. It’s important to note that the order of these names matters. In the provided pre-trained model, there are two classes: With the |
Before going ahead check the logs to be sure that there are no errors.
The final step is to deploy the "Actuator". This service will send keepalives to the Dashboard and also an alarm is the Camera stream manager detects no_helmet label in the images.
The "Actuator" service needs also to use the host network.
Also you will need to include the Dashboard backend route. Please, don’t forget the /alert and /alive as part of the environment variable value.
podman run -it --rm --network=host -e MONITORED_CLASSES=no_helmet -e ALERT_ENDPOINT=http://object-detection-dashboard-backend-USERNAME-test.apps.CLUSTER_DOMAIN/alert -e ALIVE_ENDPOINT=http://object-detection-dashboard-backend-USERNAME-test.apps.CLUSTER_DOMAIN/alive quay.io/luisarizmendi/object-detection-action:prod
The "Actuator" service needs also to use the host network. Also you will need to include the Dashboard backend route. Please, don’t forget the /alert and /alive as part of the environment variable value.
|
The value of the MONITORED_CLASSES environment variable must match with one or more of the the CLASS_NAMES configured in the Camera stream manager container. Those detections will trigger the alarm.
|
Before going ahead check the logs to be sure that there are no errors.
Now you are ready to perform the final end-to-end test. As part of the workshop materials, hardhats should be provided. If you don’t have one, you can use a cycling helmet, though this may reduce detection accuracy.
| For this initial test, you will start without wearing a hardhat. |
Once all services are up and running, follow these steps to validate the system:
1- Open http://localhost:5000/video_stream. You should see the camera feed displaying a no_helmet detection.
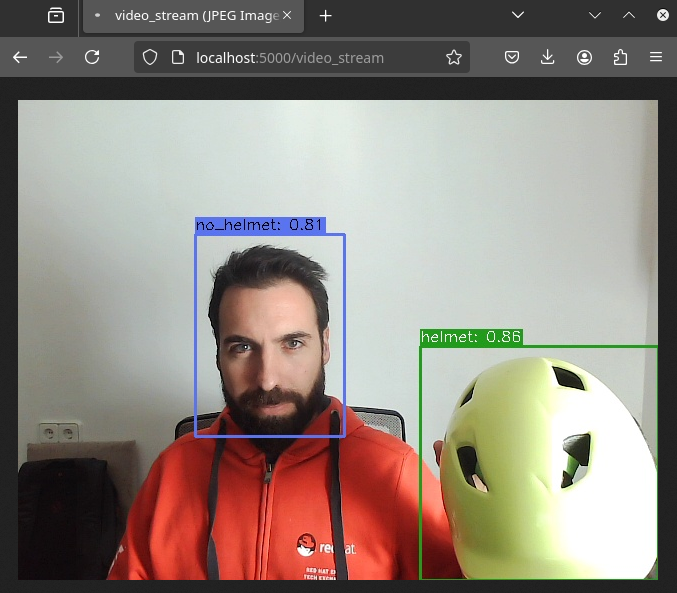
2- Open the Dashboard Frontend URL. If the camera has already detected anything (helmet or no_helmet), you will see a device listed with your MAC address as the Device Name.
3- Since the camera is detecting no_helmet, an alarm icon will appear next to your device name.
4- Put on the hardhat and observe how the system detects it in the video stream. After a few seconds, the alarm should disappear.
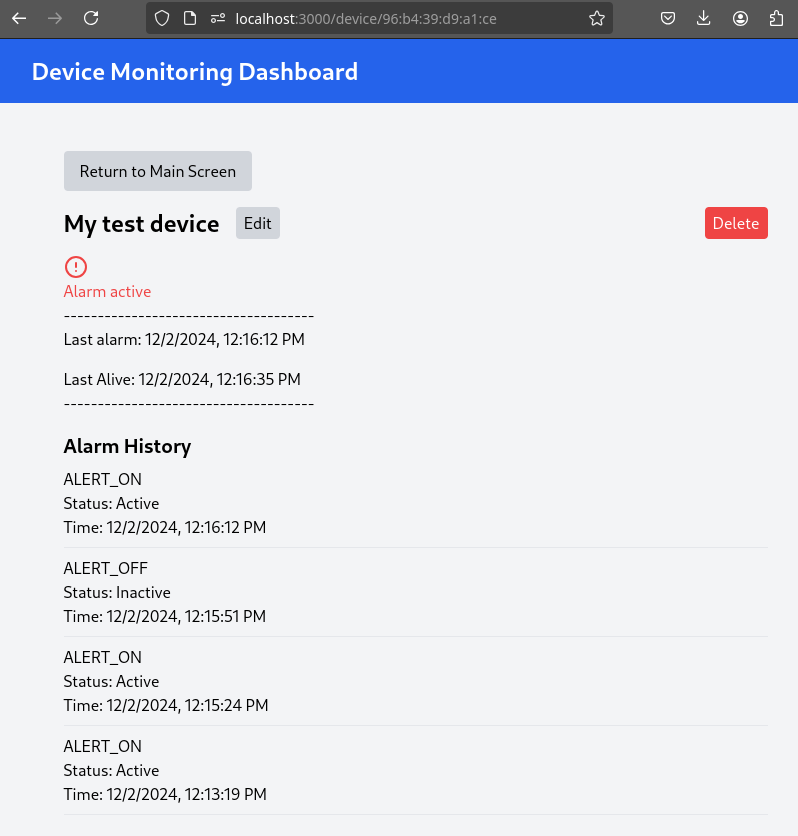
5- Click on your Device Name to view detailed information, including logged alarms. You can also rename the device to give it a more user-friendly name.
Now that you are sure that the model that you generated covers what will be needed in the field, you need to "promote" it to be used in production.
How do you promote a model to production? The approach depends on how you plan to distribute it.
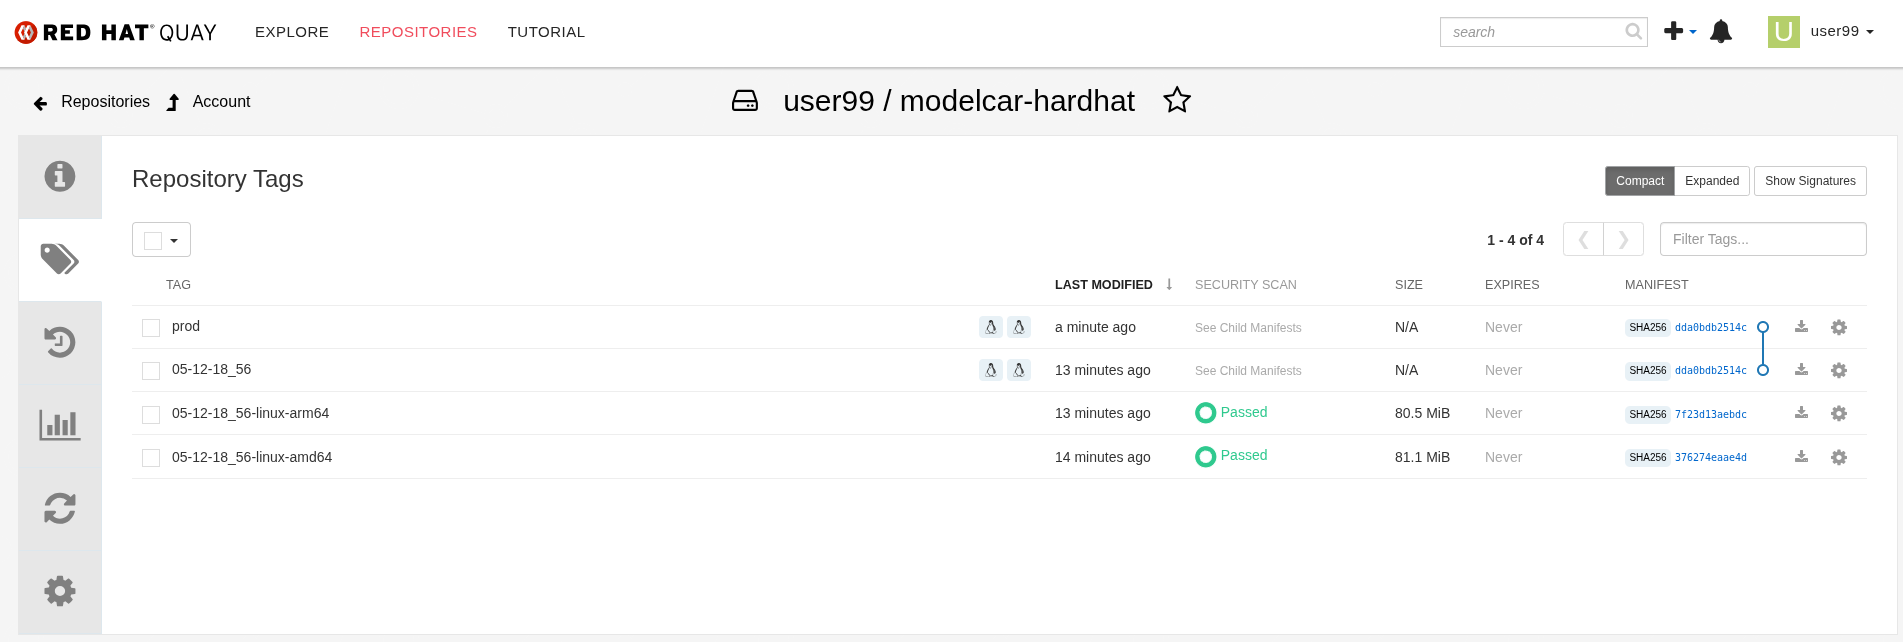
In our case, we are distributing the model as a modelcar, which is essentially a dedicated container image. Promoting the model becomes straightforward: it’s as simple as assigning the correct container image tag to the image you wish to use. For example, you can use a prod tag for the model intended for production. To do this, you’ll need to select the container image with the model you’ve just created and apply the appropriate tag. Let’s take a look at how to do this in Quay.
1- Go to Quay Container Image Registry
2- Click on the modelcar container image name
3- Click on the labels icon on the left menu
4- Click on the gear icon on the right and select "Add new tag"
5- Assign the prod tag to that image
At this stage, you are well-positioned to hand over the solution to the Platform Specialist for deployment on Edge Devices. However, if you prefer to skip that step or have already completed it in a previous part of the workshop, you can proceed to the final task for the AI Specialist.
5. Day-2 Operations
Over time, models deployed in production environments can experience a decrease in performance due to several factors.
In our example use case, the trained model for detecting hardhats on the factory floor had been deployed and working as expected. However, over time, reports started emerging about incidents where people were not wearing helmets, but the system did not trigger any alarms. After investigation, it was found that the individuals in question were wearing cups or hats, which the model did not recognize as something that could interfere with hardhat detection. Since the model was only trained to detect hardhats and not other headgear, these individuals were simply not detected, causing false negatives.
To solve this issue, retraining the model with new data is necessary.
Dataset Update
The first step to correct the problem is to have labeled data of people wearing hat and cup in order to train our model with those as well.
You need to repeat the steps that you performed, but this time you might follow the Data Management section. Remember that this time you will need to add images of hats and cups and labeling those as hat.
Retraining
In this phase you just need to re-run the training pipeline including the last version of you Dataset in the Pipeline Run setup.
Final Testing
Once you have the new model file and associated modelcar container image after retraining, you can deploy again the Inference Server with the new model.
Besides the Inference Server, there is another microservice that you need to update: the "Actuator". This microservice monitors the last predicted class, since you added a new class hat, you need to add that into the code too. In order to do that include the label in the MONITORED_CLASSES variable when you launch the service.
You have reached the end of the AI Specialist Fast-Track. You can proceed to the Platform Specialist Introduction section or if you find it useful, you can revisit the AI Specialist model following the Full Guide.